
AMD (Advanced Micro Devices, Inc.) Deep Analysis Report — Final Version
The CUDA gap is real, the HBM advantage is real, and the stock is finally at a multiple that doesn't require you to believe AMD beats NVIDIA — just that it survives alongside it.

NASDAQ: AMD | Data as of May 13, 2026
Stock Price: ~$448 | Market Cap: ~$748B
This analysis is for informational and research purposes only. It does not constitute investment advice. All investment decisions require independent due diligence.
1. Company Snapshot
Advanced Micro Devices is a fabless semiconductor company that designs CPUs, GPUs, FPGAs, and adaptive SoCs for data center, client PC, gaming, and embedded markets. Its revenue is now dominated by the Data Center segment, placing it in the Fabless (AI/GPU) profit pool — the highest-scoring pool in the framework. However, AMD is not the bottleneck controller in this pool. That position belongs to NVIDIA. This single structural fact is the central constraint on the entire investment case and informs every dimension of the analysis that follows.
AMD’s competitive identity can be summarised precisely: it is a high-execution second-source competitor in AI GPU (inference), a structural winner in x86 server CPUs, a declining participant in gaming, and an early-stage recovery play in embedded. These are four structurally different businesses bundled into one stock, and they should be evaluated separately.

2. Bottleneck Scorecard
The framework scores the sub-industry — Fabless (AI/GPU) — across four dimensions before examining the company itself. Scores reflect all post-audit refinements from the three-round audit process.
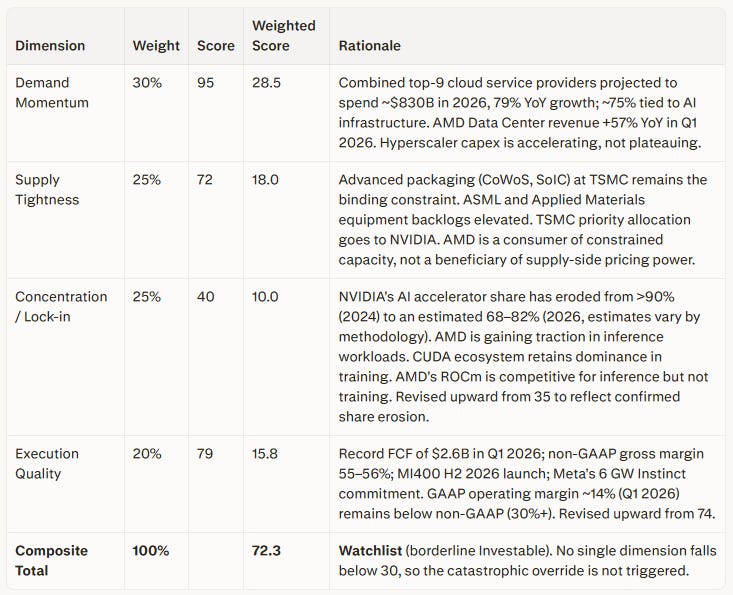
Catastrophic Override Check: Any dimension below 30 forces an automatic Watchlist downgrade regardless of composite. Concentration/Lock-in at 40 clears the override threshold, though narrowly. This is the most fragile dimension and deserves ongoing monitoring.
Investable Upgrade Threshold: ≥75 composite. AMD at 72.3 is 2.7 points below the threshold. The most plausible upgrade paths are:
Path A — Concentration rises above 50: Requires AMD to sustain AI GPU market share above 20% and demonstrate meaningful ROCm parity in training workloads. This is a multi-year path.
Path B — Execution rises above 85: Requires GAAP margin convergence with non-GAAP (closing the ~$3–4B annual amortisation/SBC gap), sustained above-consensus earnings beats, and Embedded recovery contributing $2B+ incremental high-margin revenue. This path is achievable within 12–18 months if the Embedded cycle normalises.
Path C — Combined marginal improvement: A 3-point gain in Execution (to 82) plus a 3-point gain in Concentration (to 43) would push the composite to ~74.5 — still short of 75. The threshold requires genuine, not cosmetic, improvement.
3. Business Model & Bottleneck Position
AMD is a pure fabless designer. Every advanced chip it sells is manufactured by TSMC. This creates an asset-light financial profile (low capex intensity) but introduces a structural single-point dependency on TSMC’s capacity allocation. There is no credible alternative foundry for AMD’s most advanced nodes — Samsung’s yield on leading-edge has not closed the gap with TSMC at the relevant process nodes (3nm, 2nm) for high-volume AI accelerator production.
AMD reports four segments with materially different structural profiles:
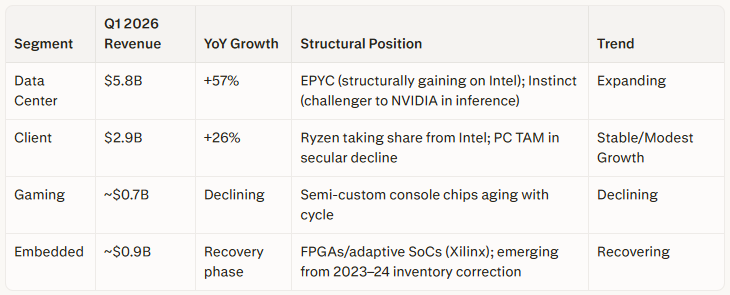
Critical analytical gap: AMD does not publicly separate EPYC (server CPU) revenue from Instinct (GPU) revenue within the Data Center segment. EPYC is a structurally stronger competitive position (genuine market share gains from Intel’s manufacturing failures; x86 switching costs). Instinct is a challenger position with genuine hardware advantages in large-model inference but no software ecosystem moat. Investors treating the entire Data Center segment as “AI GPU revenue” are conflating two businesses with fundamentally different competitive dynamics and terminal margins.
4. Financial Quality Analysis
All figures are GAAP unless explicitly stated.
Revenue and Earnings History
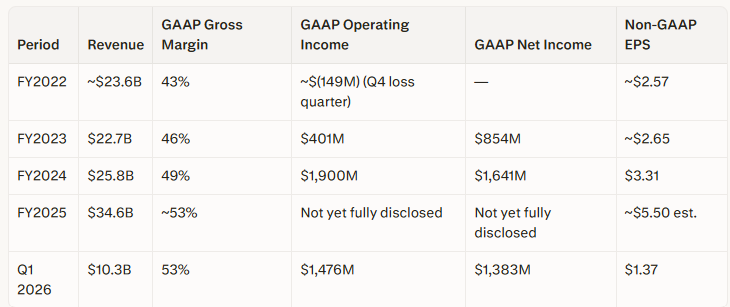
Sources: AMD SEC 8-K filings (Q4 2023, Q4 2024, Q1 2026); FY2025 from AMD IR press release February 2026.
GAAP/Non-GAAP Gap Analysis
The persistent gap between GAAP and non-GAAP results is approximately $3–4 billion per year in operating income, driven by:
Amortisation of acquired intangibles — primarily the Xilinx acquisition (~$35B goodwill and intangibles on the balance sheet). This is a real cost of the acquisition that reduces book equity and depresses GAAP ROIC.
Stock-based compensation (SBC) — a real dilution to shareholders, not a bookkeeping artefact.
Neither item is fraud, but both represent genuine economic costs that non-GAAP metrics exclude. Investors relying solely on non-GAAP multiples are overstating AMD’s true earnings power relative to its capital base.
DuPont ROE (GAAP)
FY2024 GAAP net income of $1.641B on total equity of approximately $35B (inflated by Xilinx goodwill) yields GAAP ROE of approximately 4–5% — well below the 15% quality threshold. Non-GAAP ROE is meaningfully higher but papers over the real cost of the Xilinx acquisition. GAAP ROIC remains unimpressive for a company trading at a premium multiple.
Free Cash Flow Conversion
TTM FCF as of Q1 2026: $6.74B vs. TTM GAAP net income of $4.99B → FCF/NI ≈ 1.35x. This is strong and reflects the fact that amortisation charges are non-cash, so the business generates more cash than GAAP earnings imply. The underlying cash engine is genuinely healthy.
Composite Financial Quality: Watchlist-tier. Revenue growth of 34–38% annually, margin expansion real, FCF conversion strong. GAAP ROIC modest due to acquisition burden.
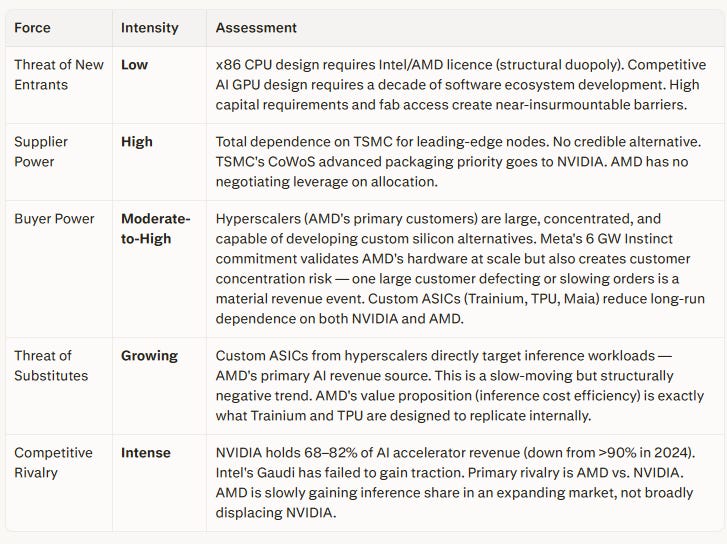
5. Competitive Position (Porter’s Five Forces)
6. Moat Analysis
EPYC Server CPUs — Genuine Durable Moat
AMD’s Zen architecture outperformed Intel’s competing products in performance-per-watt and performance-per-dollar for multiple successive generations. Intel’s self-inflicted manufacturing failures (10nm, then 7nm delays) enabled AMD to capture a structurally durable position in server CPUs. x86 server infrastructure creates meaningful customer switching costs — rewriting software for a different ISA is a multi-year enterprise undertaking. EPYC is AMD’s clearest wide-moat business.
AI GPU (Instinct) — Narrow, Inference-Specific Moat
AMD’s moat in AI GPUs is narrow, workload-specific, and contested:
Hardware advantage (real but temporary): The MI300X ships with 192 GB of HBM3 on a single GPU, allowing models requiring two H100s in FP16 to fit on a single AMD chip. This is a genuine inference-cost advantage for large-model deployment. However, NVIDIA’s Blackwell and Rubin architectures are designed to close this gap.
ROCm 7 progress (real but asymmetric): ROCm 7 (September 2025) delivered FP4/FP8 quantization support, Windows compatibility, and day-zero PyTorch/vLLM/JAX integration. For inference workloads, the ecosystem gap with CUDA has narrowed substantially — popular models run on ROCm without code changes. For training and custom kernel development, CUDA remains decisively dominant, with 89% of ML papers referencing CUDA-specific tooling. The moat distinction by workload is analytically critical: AMD has a narrow inference moat; it has no training moat.
Open-source strategy as structural signal: AMD’s ROCm open-source approach is philosophically sound as a second-mover strategy, but it is also a signal of structural weakness vs. NVIDIA’s closed CUDA ecosystem. Companies open their ecosystems when they cannot win closed. This does not make the strategy wrong; it correctly identifies the competitive reality.
Overall Moat: Narrow
Strong in x86 server CPUs. Limited and contested in AI GPU (inference-only). No durable software moat in AI training. The terminal multiple implied by a narrow moat is lower than the market currently awards — relevant to the valuation discussion.
7. Valuation Analysis (Post-Q1 2026)
Lifecycle Stage: Growth-to-Expansion (middle of a demand supercycle for AI infrastructure, concurrent Embedded recovery underway).
Current Multiples
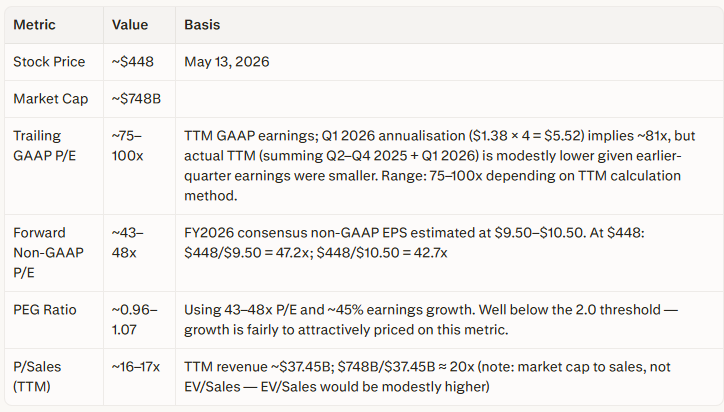
Disclosure note on trailing P/E: The $1.38 × 4 annualisation is an approximation. The actual TTM GAAP EPS would sum individual quarters (Q2 2025 + Q3 2025 + Q4 2025 + Q1 2026). Given AMD’s earnings growth trajectory, earlier quarters contributed lower EPS, making the true TTM GAAP EPS likely in the range of $4.50–$5.50, implying trailing GAAP P/E of approximately 81–100x. The forward P/E is the analytically relevant figure for an actively growing company and is more precisely sourced.
5-Year Median Multiple Context
AMD’s 5-year non-GAAP P/E history has been highly volatile: below 20x (2019), above 100x (2021–2022 peak), compressed to 30–40x (2023 downcycle). Estimated 5-year median: 45–55x non-GAAP forward P/E. This estimate is derived from market context, not a live database pull — a Bloomberg or Koyfin historical median would sharpen it.
Entry Price Derivation
The framework requires a ≥20% discount to the 5-year median multiple for full conviction entry. A 20% discount to the 45–55x median yields a target entry range of 36–44x forward P/E.
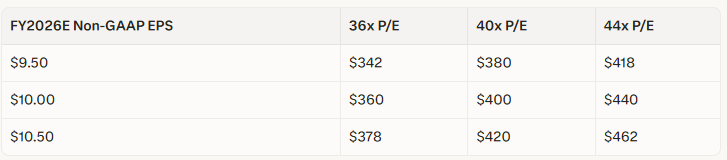
The $380–$400 price range maps consistently to a forward P/E of approximately 38–42x across the EPS estimate range — squarely within the discount zone. A pullback to this range would satisfy the Watchlist entry condition.
PEG Ratio Caveat
A PEG of ~1.0 is considered fair value under the Peter Lynch framework, but that framework was calibrated for companies growing at 15–25% annually. At 45% earnings growth, the expected PEG is lower — meaning a PEG of 1.0 at 45% growth is arguably attractively priced relative to the Lynch baseline. The PEG ratio is cited here as a sanity check that AMD is not in bubble territory, not as a precise fair value anchor.
Valuation Conclusion
AMD is no longer priced for perfection. At 43–48x forward non-GAAP P/E and PEG ~1.0, the stock trades roughly at its 5-year median multiple and does not require heroic assumptions to justify its current price — only continued execution on consensus estimates. However, the Watchlist protocol’s ≥20% discount condition is not yet met at $448. The stock belongs on a high-priority watchlist with an accumulate-on-weakness bias below $400.
8. Entry Timing Assessment
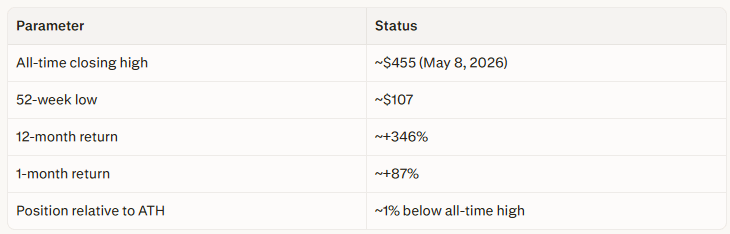
Price and Trend Context
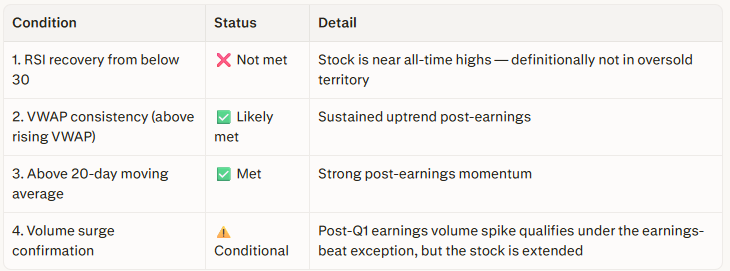
Entry Condition Stack
Position Sizing Guidance
A 30–40% starter position is defensible at current prices given the strong fundamentals, median-level valuation, and confirmed demand tailwinds. Full position sizing should wait for a pullback toward the $380–$400 entry zone. Initiating a full position at $448 carries asymmetric risk if earnings growth disappoints even modestly, as the stock leaves no valuation cushion.
9. Overall Assessment & Investment Opinion
Integration
AMD is executing exceptionally well in a historically favourable demand environment. Q1 2026 delivered $10.3B in revenue (+38% YoY), $5.8B in Data Center revenue (+57% YoY), record FCF of $2.6B, and Q2 guidance of ~$11.2B signals no deceleration. The product roadmap (MI400, next-gen EPYC) and Embedded recovery represent credible forward catalysts. None of this is in dispute.
The structural constraint is also not in dispute: NVIDIA controls the AI training ecosystem, and AMD is a challenger primarily in inference. That limits AMD’s terminal pricing power, its terminal multiple, and the confidence interval around long-term margin durability if the inference market becomes more competitive from custom ASICs.
Bull Case
Embedded recovery normalises to $4B+ annually (vs. ~$3.5B depressed in FY2024), adding $1–2B in high-margin incremental revenue. MI400 captures meaningful hyperscaler inference deployments beyond Meta. ROCm inference toolchain matures to the point where Fortune 500 enterprises adopt AMD as primary inference infrastructure. FY2027 non-GAAP EPS reaches $12+. At 50x multiple, implied price: $600+.
Bear Case
Further U.S. export controls on AI chips to China (AMD already absorbed ~$1.5B FY2025 revenue impact from prior restrictions). Hyperscaler custom ASIC programmes (Trainium, TPU, Maia) accelerate, reducing addressable market for third-party GPUs. NVIDIA’s Blackwell Ultra/Rubin closes the HBM memory bandwidth gap. ROCm fails to achieve training parity. Revenue growth decelerates below 20%, multiple compresses to 25–30x. Implied price at $9.50 EPS × 27x: ~$256.
Risk Factor Summary
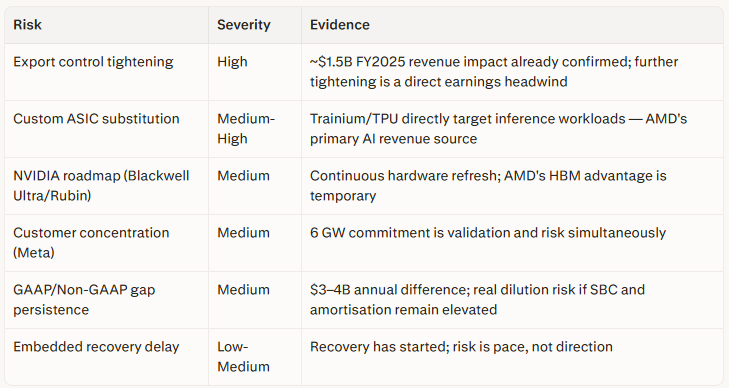
Investment Opinion
Watchlist — Accumulate on Weakness
Current price ($448): 30–40% starter position defensible. Not a full conviction buy.
Target entry zone ($380–$400): Full position sizing justified. Forward P/E 38–42x satisfies the ≥20% discount protocol.
Investable upgrade trigger: Composite ≥75, requiring either Concentration >50 (sustained AI GPU share >20%, training ecosystem gains) or Execution >85 (GAAP margin convergence, Embedded recovery materialised).
Primary monitoring variables: (1) AMD Data Center revenue as a percentage of total — if this approaches 70%+ without Embedded recovery, concentration risk is rising. (2) ROCm training adoption metrics. (3) U.S. export control policy. (4) MI400 hyperscaler win announcements.
This analysis is for informational and research purposes only. It does not constitute investment advice. All investment decisions require independent due diligence.