
Applied Materials (AMAT) — Deep Analysis Report: Semiconductor Equipment
The WFE cycle is real. Whether AMAT deserves a premium above ASML's EUV monopoly multiple is a different question entirely — and Q2 earnings is the first data point that can answer it.

Analysis date: May 14, 2026 | Ticker: NASDAQ: AMAT | Price at analysis: ~$436 (May 13, 2026 close)
Sources: SEC 8-K / FY2025 earnings release (Nov 13, 2025); SEC 10-K filing; SEMI WWSEMS (April 7, 2026); Reuters, Bloomberg, WSJ earnings coverage (Feb 12, 2026); Barchart/Zacks consensus data (May 2026); Yahoo Finance / Robinhood (May 13, 2026).
Q2 FY2026 earnings to be reported after market close today. The post-earnings update section at the end of this report provides a ready-to-execute checklist and regime map for immediate use once the print is available.
1. Company Snapshot
Applied Materials, Inc. is the largest semiconductor equipment company in the world by revenue, providing materials engineering solutions across virtually every wafer fabrication step: chemical vapor deposition (CVD), physical vapor deposition (PVD), atomic layer deposition (ALD), etch, chemical mechanical planarization (CMP), rapid thermal processing (RTP), ion implantation, metrology, inspection, advanced packaging (including hybrid bonding), and pattern shaping. No other single equipment vendor spans as many front-end process steps.
 Stock Is Down Today | InvestorPlace")
Its three reportable segments are:
Semiconductor Systems (~73% of FY2025 revenue): capital equipment sold to fabs; highly cyclical, recognized upfront.
Applied Global Services (AGS) (~23%): recurring service contracts, spare parts, upgrades on the installed base; lower-cyclicality cash flow annuity.
Display & Adjacent Markets (~4%): flat panel display tools and industrial/energy applications; non-core and declining in strategic weight.
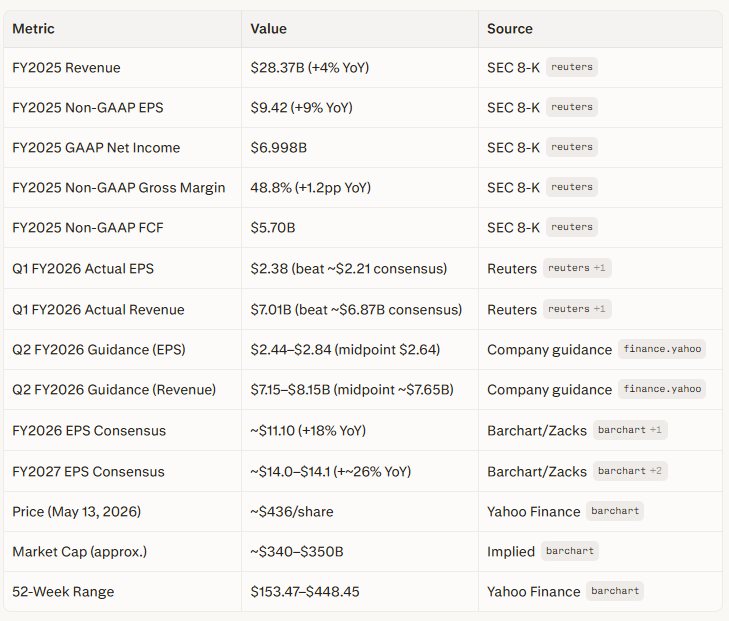
Note on FY2026 EPS guidance: The company has not issued a formal full-year FY2026 EPS guide as of Q1 FY2026 results. The $11.10 figure represents sell-side consensus, not management guidance. The pre-Q2 consensus Q2 EPS is approximately $2.66–$2.68.
2. Bottleneck Scorecard
Sub-industry: Front-end Semiconductor Equipment (WFE), classified alongside ASML, Lam Research, KLA, and Tokyo Electron.
Dimension 1 — Demand Momentum (Weight: 30%)
Global semiconductor equipment billings reached a record $135B in 2025, +15% YoY. Geographic distribution:
Taiwan: ~$31.5B (+90% YoY) on AI/HPC capacity buildout.
Korea: ~$25.8B (+26% YoY) on HBM/DRAM investment.
SEMI projects ongoing expansion: ~$143B in 2026 (+~16.5%) and ~$159B in 2027 (+~11%). Hyperscaler AI capex from major cloud providers continues to expand, supporting both advanced logic (TSMC N2/N2P, Intel 18A) and DRAM (HBM3e/4 ramp) equipment demand simultaneously.
Key caveat: foundry/logic WFE growth in 2026 is projected at ~5–6% versus ~10% in 2025, a deceleration, even though the absolute level is higher.
Score: 82/100. WFE demand is at a multi-year high. AI-pull is structural and accelerating in memory and advanced logic simultaneously. The moderate growth deceleration in foundry/logic is the sole caveat.
Dimension 2 — Supply Tightness (Weight: 25%)
Wafer processing equipment grew ~12% in 2025; back-end assembly/packaging equipment +21%, driven by advanced packaging adoption. Management guided for higher demand in the H2 calendar 2026, using language consistent with backlogs extending well beyond Q2.
Countervailing factors:
SAM share erosion: Third-party analysis indicates AMAT lost share in its Served Available Market in 2025, while Lam Research, KLA, and ASML all expanded theirs. The direction of this trend matters more than any single-year data point.
China indigenization: AMAT disclosed a ~$600M FY2026 revenue headwind from expanded US export controls, plus ~$110M in Q4 FY2025 shipments affected. Chinese domestic vendors (Naura, Hwatsing, AMEC) are gaining share in mature-node deposition and CMP.
Score: 68/100. Leading-edge equipment demand is tight; near-term backlogs are supportive. SAM share loss and China substitution at mature nodes are real constraints on AMAT-specific supply tightness.
Dimension 3 — Concentration / Lock-in (Weight: 25%)
AMAT holds a dominant global position in PVD deposition and CMP, with multiple industry sources placing its share at substantially above 50% in PVD and over 60% in CMP at leading nodes. Its portfolio breadth — spanning ALD, CVD, PVD, CMP, etch, RTP, ion implant, metrology, inspection, and now advanced packaging — allows it to offer integrated multi-step process solutions that no single narrow competitor can replicate.
Switching cost structure:
Tool qualification at N3/N2-class nodes: 18–24 months per tool, with full yield-learning risk during requalification.
Recipe and process co-development creates structural lock-in, not merely contractual.
Limiting factors:
ASML’s EUV monopoly is structurally more absolute than any AMAT position.
Second-tier competitors (Lam, TEL, Kokusai, SCREEN) are present in segments overlapping with AMAT’s portfolio.
Mature-node China's addressable market is eroding as domestic tools qualify.
Score: 72/100. Genuine quasi-monopoly pockets with structural switching costs. Moat is wide but not absolute across the entire portfolio; advanced-node lock-in is high-value, and mature-node positioning in China is weakening.
Dimension 4 — Execution Quality (Weight: 20%)
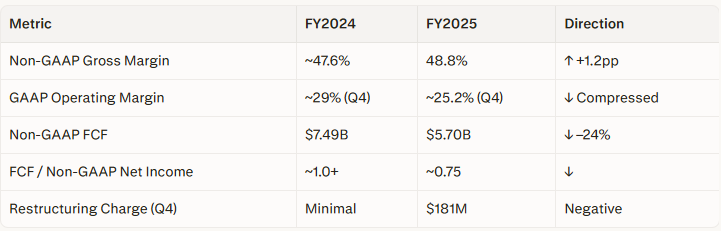
The FCF decline is management-attributed to capital investment and working-capital build in preparation for H2 2026 demand. This is a plausible explanation, but it requires validation through FY2026 FCF recovery. The ~0.75 FCF/net income ratio is above your 0.7 framework threshold but well below the ~1.0+ of the prior two years.
SAM's share loss versus Lam, KLA, and ASML in 2025 is a genuine peer-relative execution flag.
Score: 65/100. Above-average margins and durable AGS income; execution is solid but not top-quartile given the FCF deceleration, Q4 margin compression, and relative share loss.
Weighted Composite Score
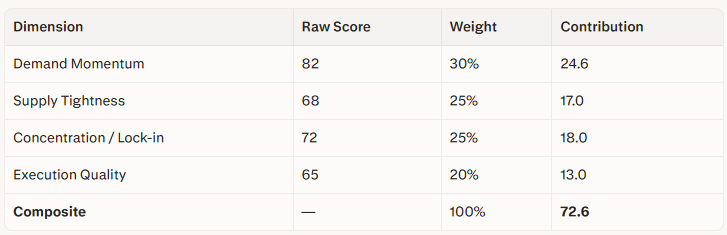
Classification: INVESTABLE. No dimension below 30; composite of 72.6 clears the ≥70 threshold. Analysis proceeds.
3. Business Model & Bottleneck Position
AMAT’s model is effectively a razor/razorblade system applied to wafer fabrication:
Semiconductor Systems generates lumpy, upfront capital revenue that follows WFE cycles.
AGS generates recurring revenue from the massive installed base, independent of whether equipment spending is rising or falling. AGS produced $6.4B in FY2025 at ~28% operating margin — a structural cash flow cushion during down-cycles.
Customer mix as of FY2025 (Semiconductor Systems segment):
Foundry / Logic / Other: ~67% of segment revenue
DRAM: ~26%
NAND Flash: ~7%
This logic-heavy mix is structurally advantageous: advanced logic transitions at the N2/N2P/A16 node (gate-all-around, backside power delivery, new interconnect metals) are materials-engineering-intensive by design, directly benefiting AMAT’s deposition and CMP leadership.
AMAT sits 2–4 quarters downstream from hyperscaler AI capex decisions. The sequence is:
Hyperscaler AI infrastructure budget → chip designer demand signals →
Foundry/memory capex authorization →
Equipment order placement →
AMAT revenue recognition.
This timing lag makes AMAT a late-cycle beneficiary on the upswing and a late-cycle casualty on any reversal. CFO commentary about H2 2026 demand acceleration fits this transmission timeline precisely.
4. Financial Quality Analysis
DuPont / FCF Table (FY2023–FY2025)
Equity figures are approximate, sourced from secondary analyst data; cross-check required against full 10-K filings.
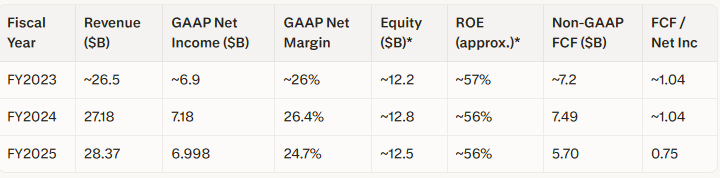
*Equity values inferred from secondary sources; should be verified against FY2025 10-K.
Critical signals:
FCF conversion dropped from ~1.04 to 0.75: still above the 0.7 framework minimum, but directionally wrong. Most likely driven by elevated capex and working-capital build, requires a rebound to ≥0.85 in FY2026 to avoid downgrading the execution score.
Revenue growth of +4% in FY2025 against WFE market growth of +15% implies AMAT under-grew the industry by ~11pp — consistent with the SAM share loss data.
ROE remains structurally high (~56%) due to strong margins and disciplined balance sheet management.
Financial Quality classification: Upper second quartile. Strong core profitability, valuable AGS annuity, and FCF above threshold — but FCF direction, below-market revenue growth, and one-quarter margin contraction prevent a top-quartile rating.
5. Competitive Position (Porter’s Five Forces)
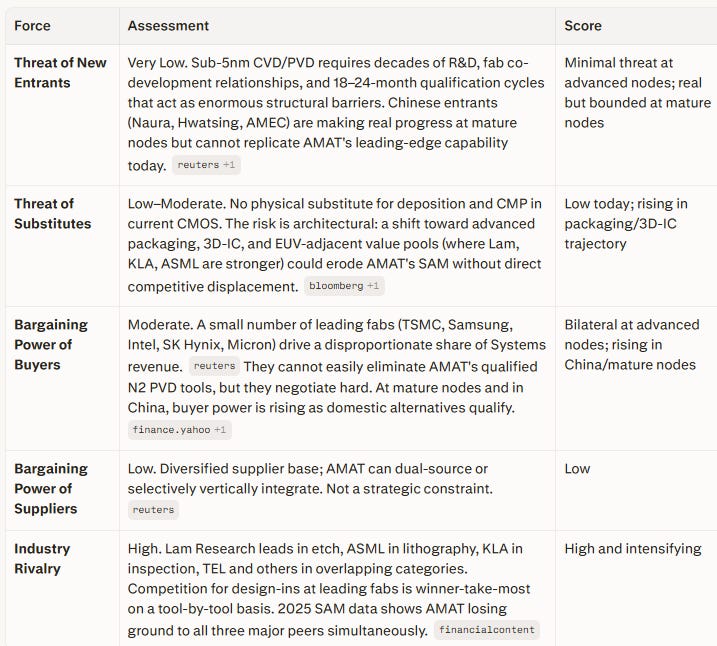
6. Moat Analysis
AMAT’s moat is wide but not exceptional — it is a composite of process IP, portfolio breadth, and structural switching costs rather than a single-tool chokepoint monopoly.
Technology / IP moat:
Strongest in PVD and CMP, where AMAT leads globally at advanced nodes. The proprietary value sits in recipe libraries, process characterization, and materials-equipment-process co-optimization accumulated over decades — not in patents alone. Competitors cannot replicate this from the documentation.
Switching costs:
At N3/N2-class nodes, replacing an AMAT-qualified PVD or CMP tool requires a full requalification cycle (18–24 months), yield risk, and significant engineering time. These costs are structural, not contractual, making them durable even without exclusivity agreements.
Portfolio breadth:
AMAT’s multi-step coverage (deposition-etch-clean-CMP on an integrated platform) reduces customer integration complexity. No narrow single-category competitor can replicate this. It is a genuine second-order moat.
Installed base / AGS loop:
Not a traditional network effect, but the large installed base generates AGS revenue and provides operational data that informs next-generation tool development — a weak but positive feedback mechanism.
Moat classification: Wide, but narrowing at the margin.
The SAM share erosion in 2025, compression of China-addressable revenue, and competitive encroachment by Lam/KLA/ASML in adjacent segments are early but real signals. The PVD and CMP strongholds at leading nodes remain intact.
7. Valuation Analysis
Lifecycle Stage
AMAT is a late-growth / mature cyclical industrial with structural AI capex tailwinds. It is not a hyper-growth company; revenue grows in mid-single to low-double digits over a full WFE cycle, with EPS growth ahead of revenue when margins expand.
Current Multiples (May 13, 2026, ~$436)
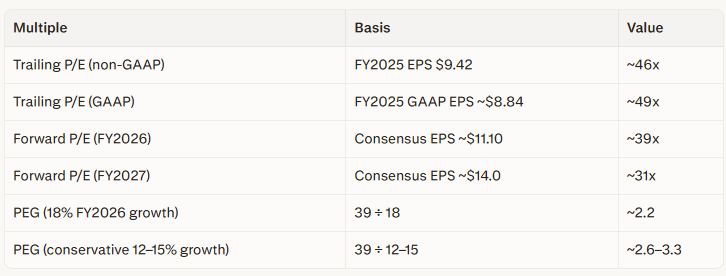
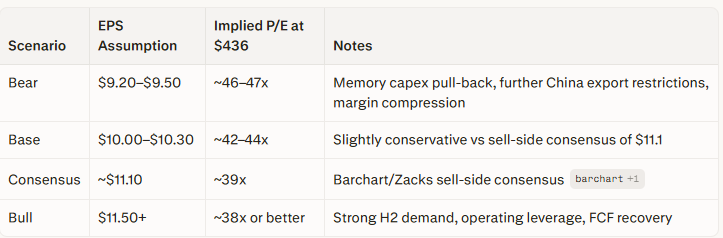
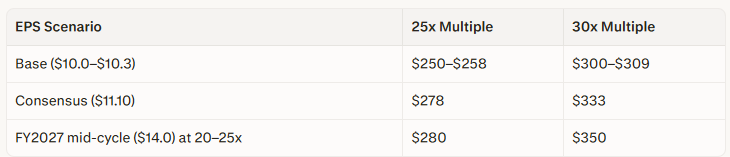
Valuation Scenario Bands (FY2026 EPS)
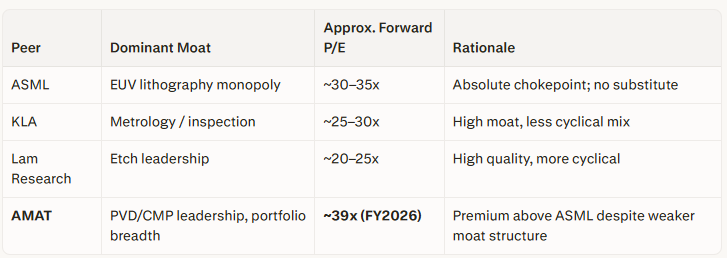
Peer Multiple Comparison
Forward Entry Price Zones (for New Capital)
Using a 25–30x multiple on forward EPS, consistent with historical cyclical peak multiples for the WFE sector:
Valuation opinion: OVERVALUED for new capital at ~$436.
The stock is priced for a scenario in which: AI/DRAM and logic cycles fire concurrently, China export damage is fully absorbed and contained, SAM share stabilizes, and FCF recovery materializes — all simultaneously. A deterioration in any one of these would compress a multiple that has no embedded margin of safety. The structural thesis is sound; the current price leaves no room for imperfection.
8. Entry Timing Assessment
Pre-earnings technical status (May 13, 2026):
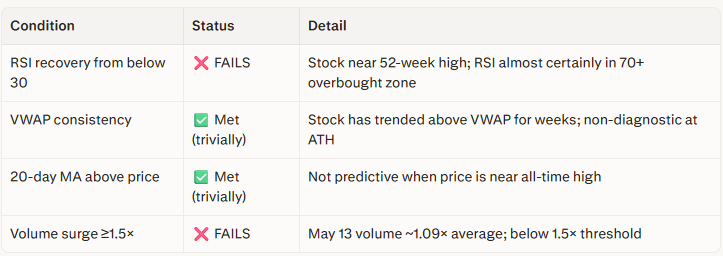
Entry verdict: Do not initiate a new position at current levels. The key RSI condition fails conclusively, volume surge is absent, and the PEG of 2.2–3.3, combined with a near-all-time-high price, creates asymmetric risk skew against any new position.
The framework’s execution score of 65/100 also disqualifies AMAT from the “top-quartile financial quality” prerequisite for the standard 30–40% starter position.
Single-session exception (post-earnings): If tonight’s Q2 FY2026 release satisfies all four of the following criteria simultaneously, a disciplined starter position may be warranted on May 15, 2026:
Material beat on EPS (>$2.84 high end of guidance) and revenue.
FY2026 guidance raised above consensus (~$11.50+ EPS).
FCF conversion guidance moving toward ≥0.85.
Next-day RSI resets below 70 (ideally 50–65), volume ≥1.5× average.
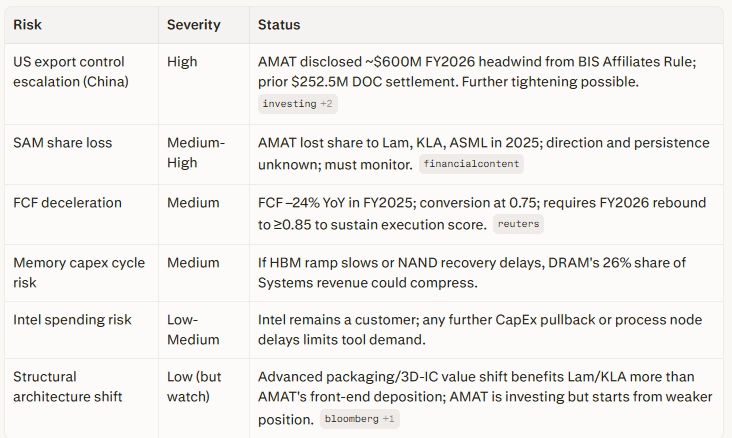
9. Known Risk Factors
10. Post-Earnings Decision Framework (May 14, 2026)
7-Question Checklist (run after the Q2 call)
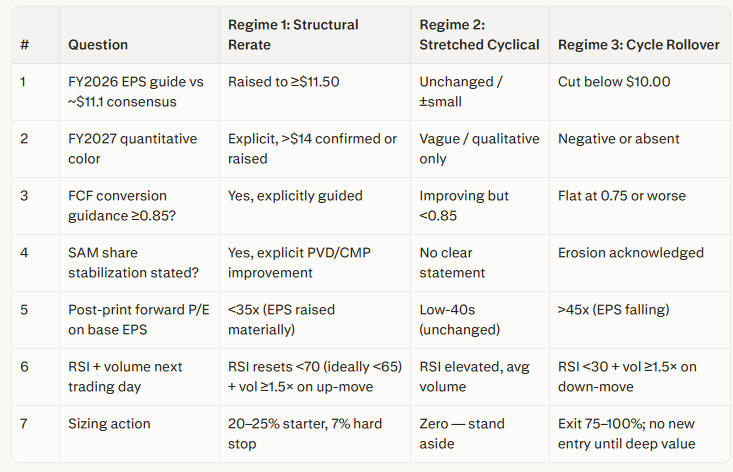
Regime-to-Action Map
Regime 1 — Structural Rerate Evidence Accumulating:
Market sees a step-change in AMAT’s normalized EPS, not just a hot cycle. Stock gaps up >5%, RSI resets on consolidation, volume confirms institutional buying. Entry: 20–25% starter at next-day VWAP within 1%, hard stop 7% below entry, scale to 50–60% only if Q3 FY2026 confirms trajectory.
Regime 2 — Stretched Cyclical, No New Catalyst:
Inline print, no meaningful guidance change, RSI stays elevated, no volume surge. The business remains high-quality but overvalued. Action: zero new capital deployed. Preferred entry zone: $250–$333, depending on EPS scenario and target multiple. Time trigger: if no correction within 3–4 months, consider covered calls on existing positions.
Regime 3 — Cycle Rolling Over / Thesis Damage:
Miss, guide-down, FCF still compressed, China headwinds widening. Stock gaps down, RSI crashes. Action: exit at least 75% of existing positions; if the 200-day MA breaches on volume, liquidate remaining. No new entry until price reaches <20x depressed bear-case EPS ($9.00–$9.50), implying sub-$190 — a scenario requiring a multi-week washout to develop.
11. Overall Assessment
Applied Materials is a genuinely high-quality industrial business at the center of the most important capex cycle in decades. Its structural position in deposition and CMP at advanced nodes is real, durable, and difficult to displace. The AGS segment provides a meaningful downside cushion. The WFE macro environment — $135B in 2025 billings, growing toward $143B in 2026 — is historically favorable.
However:
At ~39x FY2026 forward EPS on consensus and a PEG of ~2.2–3.3, the stock prices are in a high-execution scenario with no margin for error.
Three specific risks — China export escalation, SAM share persistence, and FCF deceleration — are not fully priced by the current multiple.
The central unresolved question is whether today’s EPS level represents a new structural earnings base (bullish rerate) or a cyclical peak (bearish). Neither can be confirmed from current data; tonight’s Q2 release is the next significant evidence point.
Bottom line:
Business quality: High.
Sub-industry backdrop: Favorable.
Current valuation: Stretched; not appropriate for new capital at current price.
Preferred action: Stand aside; wait for either a correction to 25–30x forward EPS (approximately $250–$333 on current consensus) or a post-earnings configuration that satisfies the single-session exception criteria in full.
This analysis is for educational and informational purposes only and does not constitute investment advice. All investment decisions carry risk; consult a qualified financial professional before acting on any analysis.