
Automatic Data Processing, Inc. (NASDAQ: ADP) — Deep Value Investment Analysis
A quick walk‑through of why ADP’s float, headcount exposure, and AI risk don’t line up with a 30% discount to its own history.

Report Date: May 16, 2026
Stock Price (approx.): ~214 USD (as of May 15–16 close; previously ~196–213)
Fiscal Year End: June 30
Market Cap: ~85–86 billion USD
Step 1: Business Model Analysis
What Does ADP Actually Do?
Founded in 1949, ADP is one of the world’s oldest and largest providers of cloud-based Human Capital Management (HCM) solutions. In plain terms: it handles payroll, HR administration, tax compliance, benefits, and workforce analytics for businesses ranging from a five-person bakery to a multinational corporation with employees in over 140 countries. ADP serves tens of millions of workers globally and manages payroll across this multi‑jurisdictional footprint.
Software Category Classification: ADP is best described as a Category Two business — a mature, subscription‑dominant HCM platform with meaningful infrastructure characteristics. It is not a pure SaaS vendor, and it is not a simple staffing company. It has three distinct revenue streams that must be understood separately:
 | Seeking Alpha")
Segment 1 — Employer Services (ES): This covers HCM software, payroll processing, tax filing, benefits administration, and compliance tools sold on a per‑employee, per‑month (PEPM) subscription basis. Employer Services’ new business bookings are in the low‑single‑digit growth range on a multibillion‑dollar basis. This is ADP’s core platform business.
Segment 2 — Professional Employer Organization (PEO) Services: Under the “ADP TotalSource” brand, ADP acts as a co‑employer, taking on HR, benefits, payroll, and workers’ compensation obligations alongside the client. The PEO segment provides HR and employment administration outsourcing solutions to businesses through a co‑employment model, including guidance, user‑friendly technology, comprehensive employee benefits, and risk management programs. PEO clients pay ADP a percentage of their payroll, so this revenue is directly tied to employment levels and wages.
Segment 3 — Client Funds Float Income: This is the hidden engine that many analysts underweight. When ADP collects payroll from employer clients several days before distributing it to employees, it holds a large pool of funds in transit. Average client funds balances in FY2025 were in the mid‑30 billion USD, earning a blended yield of roughly 3.1%. For FY2026, management guided to higher average balances and a yield around 3.4%, implying client funds interest revenue of roughly 1.29–1.31 billion USD. This float income functions like a quasi‑banking business embedded inside a payroll company — and rising interest rates directly boost it, while falling rates compress it.
Revenue Model: ADP’s pricing is primarily seat‑based (PEPM) for ES and headcount‑tied for PEO. This matters for AI risk analysis, which we address in Step 4.
Upstream Suppliers: ADP relies on cloud infrastructure providers and data center capacity. It has significant scale to negotiate favorable contracts.
Downstream Customers: ADP’s client base is extremely sticky — businesses don’t switch payroll providers casually, given the compliance risk and employee disruption involved. Accounts receivable are modest relative to revenue, indicating ADP collects payments quickly and has the upper hand with its customers.
Step 2: Financial Statement Analysis
Income Statement
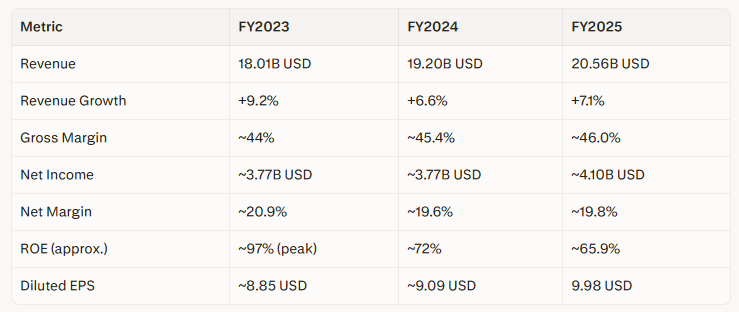
ADP’s annual revenue for FY2023 was 18.01 billion USD (up 9.2%), FY2024 was 19.20 billion USD (up 6.6%), and FY2025 was 20.56 billion USD (up 7.1%). This is consistent, mid‑single‑digit‑to‑low‑double‑digit organic growth — reliable if unspectacular.
Summary income metrics (FY2023–FY2025):
Observations:
ROE: ROE looks extraordinary but is structurally explained. ADP’s ROE peaked at roughly the high‑90s in FY2023 before settling around 65.9% in FY2025. ROE this high typically signals either exceptional profitability or a very thin equity base — for ADP, it’s both. The company aggressively returns capital via dividends and buybacks, leaving equity quite small relative to earnings. This is a capital‑discipline signal, not a red flag, but it means the ROE number needs context.
Gross Margin: Gross margin is trending upward but sits at ~46%, not the ≥70% benchmark for pure SaaS. This is important for category calibration. ADP’s gross margin is lower because PEO revenues pass through payroll costs for co‑employed workers. If you strip out PEO pass‑through costs, the underlying software margin profile is considerably higher. Analysts who apply pure SaaS multiples to ADP’s blended margin will consistently underestimate its quality.
GAAP vs. Non‑GAAP: The GAAP vs. non‑GAAP gap is minimal. Net earnings of ~4.1B USD and adjusted net earnings of ~4.1B USD were essentially identical for FY2025. This is a positive signal — ADP is not relying on aggressive non‑GAAP adjustments to flatter its earnings. The GAAP vs. non‑GAAP delta is well under 10%, so no material divergence flag is warranted.
Balance Sheet
As of FY2025, ADP held about 3.3B USD in cash and equivalents against roughly 4.0B USD in long‑term debt, with a debt‑to‑equity ratio around 0.64.
A critical note on ADP’s balance sheet: because ADP holds billions in client funds in transit, its reported total assets (84B+ USD as of the most recent quarter) are vastly inflated relative to its operating asset base. Total assets of ~84.6B USD against total liabilities of ~78.2B USD include large, largely offsetting client funds. Short‑term assets of ~74.5B USD exceed short‑term liabilities of ~72.1B USD — the balance sheet is largely symmetrical, with pass‑through obligations from the client funds business. The “real” operating leverage is far more modest than the headline numbers suggest.
ADP’s interest coverage ratio is on the order of 50x+ — interest payments are covered many times over by operating earnings. This is financial fortress territory.
Cash Flow Statement
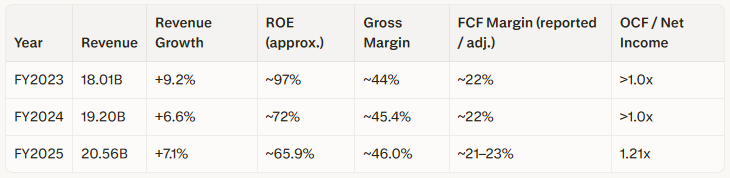
For every 1 USD of reported GAAP earnings, ADP generates materially more in operating cash flow. In FY2025, operating cash flow was around 4.9B USD vs. 4.1B USD in net income, implying OCF/NI ≈ 1.21x. Earnings quality is excellent — cash conversion exceeds 100%, easily clearing the ≥70% threshold. Accrual earnings are backed by real cash.
Reported Free Cash Flow (FCF): FY2025 reported FCF is approximately 4.4B USD (per widely used financial data sources). This implies an FCF margin of roughly 21–22% on 20.56B USD of revenue — clearing the ≥20% FCF margin threshold for mature companies.
Normalized / Adjusted FCF: A commonly used adjusted/normalized FCF estimate is around 4.77B USD, reflecting small methodological differences (e.g., treatment of leases or other items). On this adjusted basis, FCF margin is closer to 23%.
Capital was deployed deliberately in FY2025: on the order of 1.1–1.2B USD in acquisitions, ~1.3B USD in share repurchases, and ~2.4B USD in dividends. Exact figures vary slightly by source, but the pattern — significant buybacks and dividends funded from robust FCF — is clear.
Summary Financial Table (3‑Year View):
Update: Q3 FY2026 (Quarter Ending March 2026)
Revenue: ~5.94B USD, up approximately 7% YoY.
Adjusted diluted EPS: 3.37 USD, beating estimates.
Full‑year FY2026 guidance raised to:
Revenue growth of 6–7%.
Adjusted EPS growth of 10–11%.
Audit Opinion
ADP is audited by Deloitte & Touche LLP. The company has consistently received unqualified audit opinions with no material weaknesses. No flags here.
Step 3: Competitive Position (Porter’s Five Forces)
Threat of New Entrants — LOW
Building a payroll and HCM platform at scale requires an extraordinary combination of: tax compliance infrastructure across thousands of jurisdictions, trust relationships with the IRS and state tax authorities, decades of employee data, a sales force capable of reaching SMBs and enterprises simultaneously, and the capital to hold billions in client funds. ADP leads the payroll software market in recent industry data, with roughly 9–10% market share in payroll. Replicating ADP’s compliance depth and global payroll network from scratch would likely take a decade and tens of billions of dollars.
Intensity of Competitive Rivalry — MODERATE TO HIGH
The HCM market is not a winner‑takes‑all structure — it is an oligopoly with meaningful fragmentation in specific niches.
Workday commands around 22–23% of the broader HCM suite market as of early 2025, but that is an enterprise‑focused, full‑suite HCM definition.
ADP’s strength lies in payroll plus HCM across mid‑market and SMB (with meaningful enterprise exposure), while Paychex competes aggressively in small business.
While ADP generated over 20B USD in FY2025, Paychex reported around 5.6B USD in revenue, serving roughly 800,000 clients versus ADP’s 1M+ global clients.
Importantly, Workday’s reported share and ADP’s ~9.9% figure are based on different market definitions (HCM suite vs. payroll). Direct comparison requires acknowledging this apples‑to‑oranges issue.
Newer entrants like Rippling, Gusto, and Paycom are winning share in specific segments (SMB, single‑country), but none has ADP’s breadth of international compliance coverage.
Threat of Substitutes — MODERATE
The existential substitute threat is AI — specifically, whether AI agents could displace the per‑seat, per‑employee pricing model that funds ADP’s Employer Services segment. This is discussed in more depth in the Macro section.
Bargaining Power of Suppliers — LOW (Favorable for ADP)
ADP is large enough to negotiate favorable terms with cloud providers and technology vendors. Its compliance data network creates proprietary inputs that cannot easily be purchased from competitors.
Bargaining Power of Buyers — LOW TO MODERATE (Favorable for ADP)
ADP’s high client retention rates indicate customer satisfaction and demonstrate its pricing power. Switching payroll providers involves tax reconfiguration, employee re‑enrollment, and compliance risk — costs that most businesses are unwilling to absorb. This structural switching cost is the bedrock of ADP’s moat.
Step 4: Macro & Industry Environment
Interest Rate Environment — NEUTRAL TO SLIGHTLY NEGATIVE
ADP’s float income — that roughly 1.1–1.3B USD in annual interest earned on client funds — is acutely sensitive to rate policy.
When rates rise, float income expands.
When they fall, it compresses.
ADP expected full‑year FY2025 client funds interest revenue of about 1.14–1.16B USD at a blended yield of approximately 3.1%. By the FY2026 outlook, that expectation grew to around 1.29–1.31B USD at a ~3.4% yield. The associated average client funds balance for FY2026 (~37.6B USD) should be treated as an estimate/projection, not yet a fully reported final figure.
With the Federal Reserve in a rate‑cutting cycle, this tailwind will fade — the question is by how much and how fast.
Labor Market Sensitivity — MODERATE RISK
ADP’s revenue is tied to headcount — if a cooling labor market turns into a deep recession with widespread layoffs, revenue will inevitably suffer.
Employer Services revenue is largely proportional to the number of employees clients are paying.
PEO revenue is even more directly exposed since fees are a percentage of client payroll.
This is the most underappreciated cyclical risk in ADP’s model.
AI and Structural Disruption — THE CRITICAL QUESTION
ADP’s Employer Services pricing is predominantly per‑seat. AI agents that can manage scheduling, time‑tracking, benefits enrollment, and HR workflows reduce the human headcount clients need, which directly reduces ADP’s revenue base if ADP cannot reprice.
Management is aware:
CEO Maria Black has stated that “AI remains central to our technology strategy, and we are moving full speed ahead to leverage it in attracting, serving, and retaining our clients,” with new AI‑driven features like ADP Assist expected to strengthen the value proposition for both new and existing customers.
ADP also launched ADP Lyric, a new global HCM platform leveraging integrated generative AI, with initial demand described as “very strong.”
The risk is real but asymmetric:
ADP’s compliance infrastructure (multi‑jurisdictional tax filings, workers’ compensation management, benefits administration) is extraordinarily difficult to AI‑away because it requires regulatory trust relationships, not just software.
An AI agent can fill out a form; it cannot be the registered employer‑of‑record for your workforce in 140 countries.
The PEO model in particular — where ADP acts as co‑employer — is structurally more resilient to AI substitution than pure per‑seat SaaS.
Overall Macro Backdrop: Neutral. Rate compression is a headwind, labor market uncertainty is a risk, but ADP’s compliance‑driven revenue is structurally more defensible than most per‑seat HCM software.
Step 5: Moat Analysis
ADP has one of the most durable moats in American business, built across four reinforcing dimensions:
Switching Costs (Primary Moat).
Payroll is not a product anyone switches lightly. It touches employee paychecks, tax filings, and benefits elections simultaneously. Every change requires retraining, data migration, and compliance recertification. ADP’s retention rates are consistently high — the longer a client stays, the more deeply embedded ADP becomes in their workflows.Network Effects (Secondary Moat).
ADP’s DataCloud — built on payroll data from millions of workers — creates benchmarking and analytics capabilities no smaller competitor can replicate. Knowing the median salary for a software engineer in a specific city, or the average workers’ comp rate for a restaurant in a given region, is only possible at ADP’s scale. This data flywheel grows more valuable with each new client.Cost Advantages via Scale.
ADP’s return on invested capital (ROIC) is estimated at around 24–25%, well above a weighted average cost of capital (WACC) of around 7–8%, confirming ADP as a clear value creator. At 20B+ USD in revenue, ADP amortizes compliance infrastructure, data centers, and regulatory expertise across a vastly larger client base than any competitor. Paychex, its closest peer, is roughly one‑quarter of ADP’s size.Regulatory Complexity as a Moat.
This is ADP’s most underrated advantage. Processing payroll in 140 countries means maintaining tax authority relationships, compliance expertise, and audit‑ready reporting in thousands of jurisdictions. This is not a technology problem — it is a regulatory‑trust‑relationship problem. It took ADP ~75 years to build. It cannot be replicated in five.
Moat Rating: Wide.
ADP clears the threshold of structural durability. The switching‑cost moat is deep, the scale advantage is real, and the regulatory complexity creates a natural barrier that AI cannot simply automate away.
Step 6: Valuation
Current Pricing and Multiples
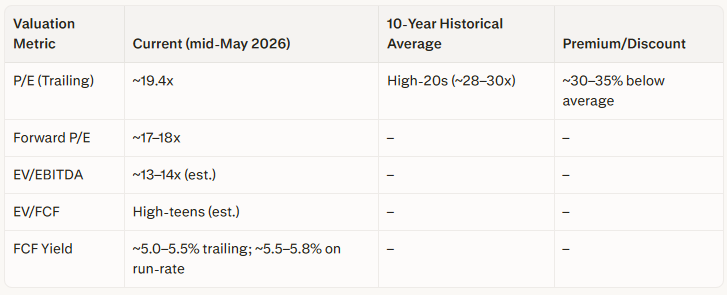
Earlier in 2026, ADP’s stock price traded around 196–213 USD, with a trailing P/E of roughly 18.8x based on TTM EPS of ~10.44 USD. At those levels, ADP’s average historical P/E ratio over the last ten years (in the high‑20s, around 28–30x depending on source and calculation period) implied the current P/E was approximately 30–35% below that historical average.
At the updated price of ~214 USD, using similar TTM EPS, the trailing P/E is ~19.4x, still meaningfully below the high‑20s historical band.
Valuation Snapshot (approximate):
Interpretation:
This is a meaningful discount relative to ADP’s own history. The market is pricing ADP as if it deserves a lower multiple than it has historically commanded — worth examining whether this is justified or an opportunity.
Why the Discount?
Three factors explain the compression:
Share Price Decline:
The stock is currently roughly 25–30% below its highs, depending on the reference peak used (52‑week vs. all‑time). That drawdown has compressed the multiple from historical norms.Float Income Normalization:
The float income tailwind that boosted earnings through 2023–2025 is becoming a headwind as rate cuts materialize. Markets are pre‑pricing the reduction in client‑funds interest income.AI Disruption Anxiety:
AI disruption anxiety is applying a discount to per‑seat HCM models broadly — ADP is being hit with the same fear as pure‑play SaaS vendors despite having structurally different economics and a compliance‑heavy PEO business.
Is the Discount Justified?
Partially.
The rate of headwind is real and will reduce float income over the next 1–2 years.
However, the ~30–35% discount to historical P/E implies either:
A permanent reduction in earnings power, or
A structural disruption to the business model.
Neither is currently evidenced in the fundamental data:
ADP raised its full‑year FY2026 guidance to revenue growth of 6–7%, EBIT margin expansion, and diluted EPS growth of 10–11%, citing increased use of AI tools such as ADP Assist and Smart Actions.
FCF margins remain above 20%, and FCF conversion remains >100% of net income.
A business generating ~4.4B USD in reported FCF (with ~4.7–4.8B USD on an adjusted or near‑term run‑rate basis), growing earnings at ~9–11%, with a 75‑year compliance moat, paying a growing dividend, and trading at ~19x earnings is not obviously cheap — but relative to its own history and quality, it is not obviously expensive either.
Reverse DCF: What Does 214 USD Imply?
To understand what the market is implicitly pricing at 214 USD, we run a reverse DCF. The goal is not to “prove” a single fair value, but to map assumptions → price.
Core Inputs (Facts vs. Assumptions)
Starting FCF (fact): 4.4B USD (FY2025 reported).
Stage 1 horizon (assumption): 5 years.
Stage 1 FCF growth (assumption): 8% (central case, reflecting 6–7% revenue growth, guided EPS growth of 10–11%, and modest margin improvement).
Terminal growth (assumption): 2.0–3.0%.
Discount rate (assumption): 8.0–9.0% (8% for quality/low leverage, 9% as a conservative equity hurdle).
Diluted shares (fact): ~400M → equity value ≈ 85.6B USD at 214 USD per share.
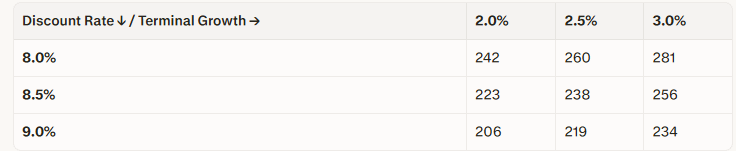
Sensitivity Table (Stage 1 FCF Growth Fixed at 8%)
Implied Fair Value per Share (USD)
(FCF₀ = 4.4B USD, 5 years at 8% FCF growth)
Interpretation:
At 214 USD, the price lines up most closely with the bottom‑left region of the table:
~9% discount rate with ~2% terminal growth (implied fair value ~206 USD), or
~8.5% discount rate with a terminal growth rate a bit above 2.0%.
In other words, the market is effectively pricing ADP as if its long‑term FCF per share will grow only slightly faster than nominal GDP, and as if the appropriate discount rate is on the high side for a business of this quality.
Three Explicit Scenarios
Conservative (Market‑Implied) Scenario
Stage 1 FCF growth: 6% (low‑end revenue, little margin lift).
Discount rate: 9%.
Terminal growth: 2.0%.
→ Implied fair value: ~190 USD per share.
Conditional interpretation:
Conditional on these conservative FCF growth, discount rate, and terminal growth assumptions, the model suggests that at 214 USD the stock prices in more optimistic than this scenario allows, i.e., the conservative scenario would argue for modest downside if ADP underperforms its own guidance.Base Case Scenario
Stage 1 FCF growth: 8%.
Discount rate: 8.5%.
Terminal growth: 2.5%.
→ Implied fair value: ~238 USD per share.
Conditional interpretation:
Conditional on this base case (consistent with current guidance and modest margin expansion), 214 USD represents roughly a 10% discount to model‑implied value. This is not a deep‑value fire sale, but it is attractive for a wide‑moat compounder.Quality‑Premium Scenario
Stage 1 FCF growth: 9.5% (EPS guidance plus some float normalization).
Discount rate: 8.0% (reflecting high moat quality and low leverage).
Terminal growth: 3.0%.
→ Implied fair value: ~300 USD per share.
Conditional interpretation:
Conditional on sustained high‑single‑digit to low‑double‑digit FCF growth and a lower discount rate that reflects ADP’s quality, the upside from 214 USD becomes substantial. This is not a forecast; it is a scenario showing what the market may eventually price if ADP’s quality and growth are re‑rated.
Key point:
The reverse DCF shows that the stock is currently priced as if ADP is a good, quasi‑utility‑like cash generator with modest long‑term growth and a relatively high equity risk premium — not as a high‑quality, 10%+ EPS growth compounder with a wide moat. That gap between implied and demonstrated performance is the margin of safety.
Entry Timing (Framework Section F)
ADP does not currently meet the strictest two‑condition entry framework (fundamentals + price confirmation) perfectly:
Fundamentals remain solid (earnings and guidance are accelerating, cash flows are strong).
The stock, however, is still trading below its 12‑month average P/E in the high‑20s and remains below its prior highs, with technicals not yet clearly signaling a durable trend reversal.
Conditional view:
Conditional on the fundamental thesis and the reverse DCF assumptions outlined above, a 30–40% starter position is defensible for value‑oriented investors who have done the work, with full sizing appropriate only if price and technicals confirm (e.g., reclaiming prior resistance levels, multiple re‑rating toward the mid‑20s).
Framework Failure Modes (Addendum Section E)
Three risks that the above analysis and models cannot fully protect against:
Rate Shock:
If the Fed resumes rate hikes, ADP’s float income will benefit — but if the broader market reprices long‑duration assets downward in response to macro stress, ADP’s multiple could compress further even as fundamentals hold.Recessionary Employment Shock:
A genuine labor market downturn — not a mild softening but a 2008‑style unemployment spike — would reduce both ES and PEO revenues simultaneously. ADP has no pricing lever to offset a 20%+ reduction in client headcount.AI Per‑Seat Compression:
If AI agents genuinely collapse the number of human workers that clients need to manage (reducing their “employee count” on the platform), ADP’s per‑seat revenue base could erode. Management’s pivot toward outcome‑based and usage‑based features is the right strategic response, but execution risk is real.
Summary Scorecard
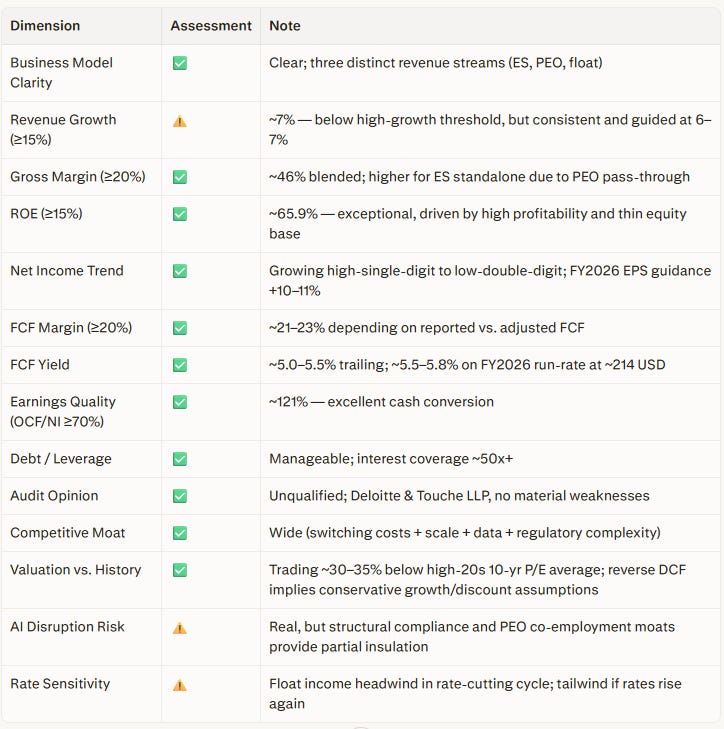
Overall Investment Posture (Conditional Statement):
Conditional on ADP continuing to execute close to its current guidance (6–7% revenue growth, 10–11% EPS growth), maintaining FCF margins above 20%, and avoiding a severe employment shock, ADP appears to be a high‑quality, wide‑moat business trading at a meaningful discount to the growth and stability it has historically delivered. It is not a hyper‑growth story — ~7% revenue growth is moderate — but the combination of FCF generation, earnings quality, dividend growth, and structural defensibility makes it worth serious consideration for long‑term, value‑oriented investors. The current discount exists because the market is, in effect, embedding conservative assumptions about long‑term growth and risk more consistent with a “good utility” than with a wide‑moat compounder. If those assumptions prove too pessimistic, the upside from multiple re‑rating and compounding FCF is meaningful.
Disclaimer: This analysis is for educational and informational purposes only and does not constitute investment advice. All investment decisions should be made with your own due diligence and, where appropriate, consultation with a qualified financial advisor. Past performance does not guarantee future results.