
AXT, Inc. (AXTI) Deep Analysis Report — Semiconductor
Analyst consensus is $41. The stock trades at $128. Someone is very wrong about indium phosphide substrates.

1. Company Snapshot
AXT, Inc. (NASDAQ: AXTI) is a Fremont, California–headquartered material science company that designs, develops, and manufactures high-performance compound and single-element semiconductor wafer substrates. Its three core products are indium phosphide (InP), gallium arsenate (GaAs), and germanium (Ge) substrates — wafer materials used when conventional silicon cannot meet the performance requirements of advanced optoelectronic and semiconductor devices. End markets include AI data center optical connectivity (silicon photonics), 5G infrastructure, passive optical networks (PON), satellite solar cells, lidar, and RF amplifiers. AXT also holds partial ownership in over ten Chinese raw-material joint ventures, providing upstream supply-chain integration through its Beijing subsidiary, Tongmei.
Sub-industry classification: Semiconductor Materials (Compound Substrate Wafers)
Stock price (as of May 13, 2026): ~$128.81 (NASDAQ: AXTI)
Market capitalization (as of May 12–13, 2026): Approximately $6.83–$8.24B. Note: the spread between sources reflects extreme recent volatility and differences in share count methodology (basic vs. fully diluted post-April 2026 equity offering). The stock reached an all-time high of $132.48 on a 52-week basis.
52-week range: $1.32 – $132.48. This represents an approximately 9,950% gain from the 52-week low to the recent high — a near-100× move reflecting one of the most extreme rallies in the semiconductor sector over the past year.
Consensus analyst price target (as of May 15, 2026): $41.33. This represents approximately 68% downside from current levels and is the single most important valuation signal in this report: Wall Street’s average view values AXT at roughly one-third of its current market price.

2. Bottleneck Scorecard Assessment
The governing question for AXT is: where is the bottleneck in the AI optical interconnect supply chain, and does AXT control it? Compound substrate wafers — particularly InP — are the foundational input for the lasers and photodetectors that move data inside AI data centers at the speed of light. AXT sits at an unusual intersection: it is both a materials bottleneck and a beneficiary of the broader AI infrastructure buildout.
Dimension 1 — Demand Momentum (Weight: 30%)
The AI data center upgrade cycle is the most powerful structural demand driver in semiconductors today. Hyperscaler capital expenditure is on track to grow approximately 67% year-over-year in 2026, according to Stifel analyst Ruben Roy. The WSTS Autumn 2025 forecast projected global semiconductor market sales of ~$772 billion in 2025 (+22%) and ~$975 billion in 2026 (+26%), with Logic and Memory both expected to grow over 30% and Optoelectronics recovering at a moderate +3–4% — though the optoelectronics category does not capture the explosion in InP demand specifically tied to AI optical connectivity. Q1 2026 global semiconductor sales were up 25% sequentially versus Q4 2025, confirming the trajectory.
For AXT specifically, InP revenues grew over 250% sequentially in Q3 2025 alone, and Q1 2026 InP revenue reached $13.6 million (over 50% of total Q1 revenue of $26.9 million) with a record $100 million backlog. Management guided Q2 2026 total company revenue of at least $34 million, which would be the highest quarterly result in company history. Separately, management expects InP-specific manufacturing capacity to reach $35 million per quarter by end-2026, rising to $65–70 million per quarter by end-2027.
Important distinction: Q2 2026 guidance of $34M refers to total company revenue across all segments (InP, GaAs, Ge, and raw materials), not InP revenue alone. The $35M/quarter InP capacity target by end-2026 is a production capability milestone, not a near-term revenue forecast. InP represented approximately 50% of Q1 2026 revenue, meaning the company must continue scaling InP while maintaining or growing other segments to reach the guided total.
Dimension 1 Score: 80/100. Hyperscaler capex expanding >20% YoY; InP-specific demand inflecting sharply; strong pricing power evident in backlog formation and revenue mix shift. WSTS optoelectronics growth looks modest on the surface but undersells InP-specific AI-driven dynamics.
Dimension 2 — Supply Tightness (Weight: 25%)
The InP substrate market is acutely supply-constrained. Analyst commentary suggests AXT controls approximately 80–90% of the global InP wafer market alongside two other companies, creating a structural chokepoint. Note: This market share figure originates from sell-side analyst estimates rather than independent market research; it should be treated as informed commentary rather than verified fact.
AXT’s own production has been limited by export permit bottlenecks — export licenses from Chinese authorities are required to ship InP wafers from its Tongmei facility. This creates episodic supply shocks even when demand is robust. The company added roughly 25% more InP capacity since Q4 2025 and is actively doubling capacity in 2026 via brownfield expansion. A new greenfield facility for InP is being planned for 2027, requiring $100–150 million in capex. Global semiconductor equipment spending was forecast to reach $133 billion in 2025 (+13.7%) and $145 billion in 2026 (+9%), supporting continued capacity expansion intent across the industry.
The supply constraint is real and will persist through at least 2026: brownfield expansion proceeds faster than greenfield, but even doubling InP capacity only supports ~$35 million per quarter in manufacturing throughput — against a $100 million backlog. The key risk here is that permit timing is outside AXT’s direct control.
Dimension 2 Score: 72/100. Genuine supply tightness at the InP wafer layer; ASPs and backlog formation confirm pricing power. Score is capped rather than higher because the bottleneck’s enforcement mechanism — export licensing — is a regulatory variable, not a technology or capital moat.
Dimension 3 — Concentration / Lock-In (Weight: 25%)
AXT and two unnamed competitors control approximately 80–90% of global InP wafer supply, according to analyst estimates. InP is not a commodity like silicon; the substrate must be precisely matched to the wavelength and performance requirements of the laser or photodetector device, creating customer-specific qualification cycles. Once an InP supplier is designed into a Tier-1 transceiver or photonic integrated circuit (PIC) manufacturer’s process, switching is slow and expensive — it requires re-qualification that can take six to eighteen months. AXT’s proprietary furnace-design capability (it designs and builds its own crystal growth furnaces internally) and its vertical integration through Tongmei and other raw-material subsidiaries constitute genuine structural differentiation within the subset of InP producers. Management noted that AXT is already embedded in multiple US hyperscalers’ supply chains and is engaging with Tier-1 transceiver companies at an accelerating pace.
However, the market is not a monopoly: Coherent Corp. (COHR) and Lumentum, both of which have in-house laser chip capacity, are scaling into 800G and 1.6T transceivers using InP technology, meaning AXT competes with vertically integrated players at the device level even if AXT’s substrate is an upstream input.
Dimension 3 Score: 70/100. Concentrated market (3 players dominate according to analyst estimates); design-in switching costs are real and meaningful; AXT’s vertical raw-material integration provides cost and quality advantages. Concentration is strong but not monopolistic, and vertically integrated competitors at the device level constrain pricing freedom over the long run.
Dimension 4 — Execution Quality (Weight: 20%)
This is the weakest dimension for AXT currently, reflecting several years of severe financial difficulty. Revenue fell from $141 million in 2022 to $75.8 million in 2023 (–46%), recovered to $99.4 million in 2024 (+31%), and then declined again to $88.3 million in 2025 (–11%). GAAP net loss in fiscal 2025 was –$21.3 million (net margin: –24.1%). Through the nine months ended September 2025, gross profit was only $6.4 million on $65.3 million in revenue — a 9.8% gross margin — with Q1 2025 gross margin near zero or slightly negative and Q2 2025 at approximately 8%. ROIC has been deeply negative throughout 2023–2025.
The Q1 2026 inflection is striking: gross margin improved to 29.6% GAAP (29.9% non-GAAP), driven by InP volume and mix shift. The company guided Q2 2026 to GAAP and non-GAAP profitability for the first time in years, with EPS guidance of $0.06–$0.08 GAAP versus prior consensus of –$0.01. Inventory remained elevated at $77.7 million as of September 2025 versus $85 million at December 2024, suggesting controlled reduction but still representing nearly 88% of FY2025 annual revenue — a yellow flag.
FCF conversion has been poor and negative in recent years. The $632.5 million capital raise completed in April 2026 for Tongmei’s InP expansion dramatically strengthens the balance sheet but significantly dilutes existing shareholders.
Dimension 4 Score: 42/100. Three consecutive years of operating losses with a recent Q1 2026 inflection; margins recovering but only barely out of distress territory; ROIC deeply negative through 2025; FCF conversion broken in the recent loss cycle. The positive trajectory is real, but it is very early to call this “execution quality” restored.
⚠️ Catastrophic Weakness Override Check: Dimension 4 scores 42, which is between 30 and 50 — below the 50 threshold for “stable” but above the 30 threshold for catastrophic weakness. No override is triggered; the sub-industry proceeds to Watchlist analysis rather than automatic Avoid.
Scorecard Synthesis
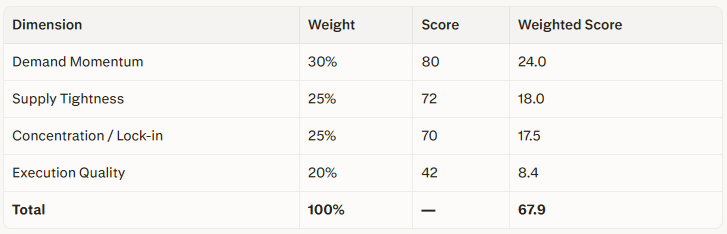
Classification: WATCHLIST (Score 67.9, range 50–69)
The sub-industry structural environment is positive — demand is strong, supply is tight, and the market is concentrated — but execution quality sits in distress territory. A great individual company may still be investable, but the thesis requires stronger company-specific proof of durable moat, sustained margin recovery, and a valuation discount. The analysis proceeds with this elevated bar.
3. Business Model & Bottleneck Position
AXT operates as a materials controller: it does not design or fabricate semiconductor chips, but rather produces the substrate wafers upon which chip manufacturers (laser diode makers, transceiver manufacturers, photonic integrated circuit companies) grow their active structures. This positions AXT upstream of a supply chain that looks like:
InP substrate → laser/photodetector epitaxial growth → chip fabrication → transceiver module → data center optical interconnect
Its revenue is divided into two segments: substrate products (68% of 2024 revenue) and raw materials from its partially owned Chinese joint ventures (32% of 2024 revenue). The InP product is the current growth engine; GaAs serves mobile RF and other applications; Ge serves satellite solar cells. The dual-segment structure provides some diversification but also ties AXT’s fortunes heavily to China — its manufacturing is in three locations in Beijing/China, and its raw-material supply chain runs through its Tongmei subsidiary and affiliated companies. Approximately 86% of revenue comes from customers outside North America.
AXT’s most distinctive competitive feature is its proprietary furnace design: it engineers and builds its own crystal growth furnaces internally, which management asserts gives it both cost control and the ability to scale capacity faster than competitors who rely on third-party equipment. This is the kind of tacit manufacturing know-how that is genuinely hard to replicate. However, it means the scaling bottleneck is internal engineering capacity rather than equipment procurement lead times.
4. Financial Quality Analysis
Revenue History (Fiscal Years Ended December 31)
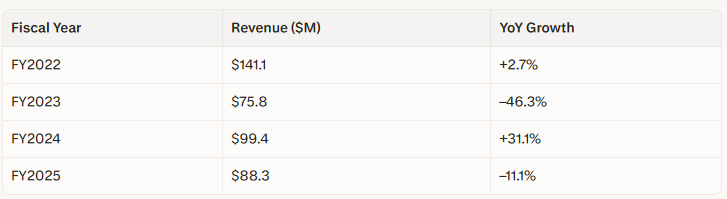
Source: WallStreetZen / Yahoo Finance, May 2026
The revenue trajectory is not a growth story — it is a severe-cyclical-recovery story. The 2023 collapse was driven by post-COVID destocking across the semiconductor supply chain and weakness in 5G and LED end markets. The 2025 decline came despite 31% growth in 2024, largely because Q1 and Q2 2025 were still weak before the InP demand surge hit in Q3 2025.
Income Statement Summary (FY2022–FY2025)
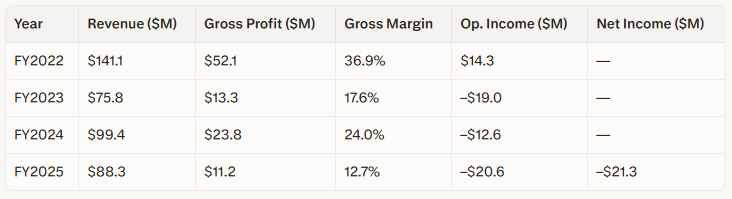
Source: Yahoo Finance income statement data, May 2026
The gross margin collapsed from 36.9% in FY2022 to 12.7% in FY2025, reflecting severe underabsorption of fixed costs during the revenue trough, particularly in Q1–Q2 2025, when gross margins were near zero or negative (Q1 2025) and approximately 8% (Q2 2025). Q1 2026 GAAP gross margin recovery to 29.6% is a genuine improvement but remains below the FY2022 peak, indicating that full margin recovery requires volume to continue scaling.
DuPont ROE Decomposition (Approximate, based on available data)
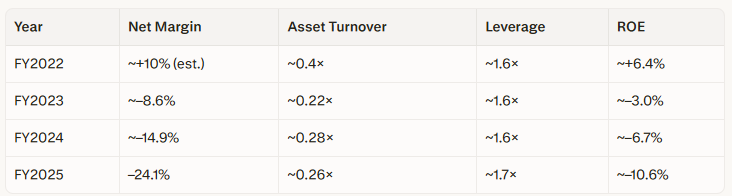
Note: Net margin for FY2022 is estimated from operating income and historical patterns; the exact figure is not available in the search results. Asset turnover is derived from approximate total assets (~$340M) and annual revenue.
ROE has been negative and deteriorating — a clear financial quality failure. The equity base is now inflated by the $632.5M Tongmei capital raise, which will likely improve this ratio mechanically but does not represent organic earnings power recovery.
FCF Conversion
FCF has been negative in FY2023, FY2024, and FY2025. The company’s working capital has been absorbed by inventory accumulation during the revenue trough ($77.7M inventory versus $88.3M annual revenue as of September 2025) and capital spending on the manufacturing footprint. FCF conversion is well below the 0.7× threshold required for a top-quartile score.
Balance Sheet Highlights (as of September 30, 2025)
Total assets: $334M
Cash and restricted cash: $31.2M
Inventories: $77.7M
Short-term loans: $61.5M
Total liabilities: $93.6M
Total stockholders’ equity: $202.3M
Debt-to-equity ratio: approximately 0.36 (long-term debt only; short-term loans add complexity)
The subsequent $632.5M Tongmei capital raise (completed April 2026) significantly improves liquidity but involves complex noncontrolling interest dynamics and material shareholder dilution.
Composite Financial Quality Score: Below Average (2/5)
The company fails on nearly every quantitative financial screen: negative ROE, negative FCF, net losses for three consecutive years, and margins deeply depressed. The only redemptive element is the Q1 2026 inflection and the record InP backlog, suggesting near-term improvement. Audit opinion was unqualified (no going-concern language found in public filings reviewed), which is a baseline pass. This means the investment thesis must rest overwhelmingly on the forward trajectory, not the historical financials.
5. Competitive Position (Porter’s Five Forces)
Threat of new entrants: Low to moderate. InP crystal growth is a highly specialized process requiring proprietary furnace engineering, deep materials science expertise, cleanroom infrastructure, and access to high-purity precursor chemicals. The capital barriers are meaningful ($100–150M for a new greenfield InP facility per AXT’s own guidance ), and the time-to-market for a new entrant starting from scratch would likely be five or more years. However, the market’s attractiveness at current pricing will attract capital, particularly from Chinese domestic players motivated by supply security. AXT’s proprietary furnace design is a temporary moat against equipment-based replication, not an impenetrable one.
Bargaining power of suppliers: Moderate. AXT’s vertical integration through Tongmei and its raw-material joint ventures meaningfully reduces supplier leverage for critical inputs like indium metal and phosphine. However, indium is a rare byproduct of zinc smelting and is geopolitically concentrated (China controls over 70% of global refined indium production). Any regulatory restriction on indium exports would be an acute risk.
Bargaining power of buyers: Moderate and improving for AXT. Historically, AXT served small and mid-tier customers, giving buyers leverage through multiple-supplier qualification. The shift to Tier-1 hyperscaler supply chains and the emergence of a $100M backlog suggest buyers are now competing for AXT’s constrained supply, temporarily shifting power toward AXT. Once capacity expands and supply normalizes, pricing power will moderate.
Threat of substitutes: Low to moderate in the medium term. Silicon photonics has been seen as a potential substitute, but silicon-based optical components still require InP-based lasers as the light source — meaning silicon photonics expands the demand for InP rather than substituting it. Over a 10-year horizon, new photonic materials (silicon nitride, gallium nitride, or integrated heterogeneous platforms) could reduce InP’s necessity, but the transition timeline is long relative to the current investment thesis.
Rivalry among existing competitors: Moderate to intense. The InP substrate market is effectively a three-player oligopoly (AXT and two others controlling 80–90% of supply according to analyst estimates ). This concentration moderates price competition in the near term. However, vertically integrated device manufacturers like Coherent (COHR) and Lumentum grow their own epitaxial structures and may gradually insource substrate production, potentially reducing the independent substrate market over time.
6. Moat Analysis
AXT’s competitive position has historically been narrow — it has been a niche materials supplier with limited pricing power and cyclical vulnerability. The AI-driven InP boom creates a temporary widening of the moat through supply scarcity, but the durable, structural moat elements are more modest:
Technology and IP — Moderate. Proprietary crystal growth furnace design is AXT’s most differentiated capability. Competitors must either purchase third-party furnaces (slower to scale, less IP-protected) or develop equivalent internal capabilities (capital and time-intensive). AXT’s ongoing R&D into 6-inch InP wafers (versus the current 4-inch standard) would extend the technological lead and qualify AXT for next-generation transceiver designs that require larger-diameter substrates.
Switching costs — Moderate. Device qualification cycles (estimated at 6–18 months based on industry norms for compound semiconductor substrates) create stickiness for existing supplier relationships. However, Tier-1 customers (hyperscalers, major transceiver makers) typically require dual-sourcing for supply security, which limits exclusivity.
Scale advantages — Modest. At $88M annual revenue (FY2025), AXT is a small company with limited scale leverage on fixed costs. As InP revenue scales toward $35M per quarter, manufacturing capacity ($140M annualized from InP alone), fixed-cost absorption will dramatically improve margins — but only if execution is sustained.
Unique resources — High relative importance. Access to Chinese raw-material supply (indium, phosphine) through vertically integrated subsidiaries is a genuine resource advantage that is very difficult to replicate outside China in the short term.
Network effects — None. Materials companies do not benefit from network effects.
Overall moat width: Narrow, with a cyclically widening supply-scarcity premium. The true structural moat is the furnace IP and the raw-material integration; the current outsized pricing and backlog reflect a supply-demand imbalance that will partially normalize as capacity expands.
7. Valuation Analysis
Lifecycle Stage
AXT is in a turnaround/early-growth re-acceleration stage — not a mature compounder. The valuation must therefore be analyzed on a forward basis; historical multiples are largely meaningless given the losses.
Current Valuation
With a market cap of approximately $6.83–$8.24B (sources vary; a central estimate of ~$7.0B is used for analysis, as of May 13–15, 2026) and FY2025 revenue of $88.3M, the trailing price-to-sales ratio is approximately 79×. This is an extraordinary valuation for a materials company. P/E is not meaningful given persistent losses (the current negative P/E ratio of –388×, confirms this ).
Most important valuation benchmark: The consensus analyst price target as of May 15, 2026, is $41.33 across three analysts. This implies the market is pricing AXT at approximately 210% above the average Wall Street target — or equivalently, consensus targets imply 68% downside from current levels. This gap is the single clearest objective signal that current valuation has detached from fundamental analysis.
Individual analyst targets (as of May 1, 2026):
Wedbush (Outperform): $93 (raised from $28)
B. Riley (Neutral): $73
Northland: $90
Notably, the stock has already surged past all three targets. Critical caveat: These targets may predate or only partially reflect the April 30 Q1 earnings beat and subsequent guidance raise. Analyst models often lag price in fast-moving narratives. The $41.33 consensus average likely includes older, non-updated models and should be monitored for revisions over the coming weeks.
The stock has risen approximately 9,950% from its 52-week low of $1.32 to the recent high of $132.48 — a near-100× move that represents one of the most extreme rallies in the semiconductor sector over the past year.
Forward Estimates
Q2 2026 guidance: Total company revenue of at least $34M with GAAP/non-GAAP profitability (EPS guidance: $0.06–$0.08 GAAP, versus prior consensus of –$0.01). This would represent the highest quarterly revenue in company history.
Capacity roadmap (management targets):
End-2026: $35M per quarter InP manufacturing capacity
End-2027: $65–70M per quarter InP manufacturing capacity
Revenue backsolve test (valuation reality check):
At a $7.0B market cap, if we assume a mature materials company valuation multiple of 6–10× sales (typical for profitable, scaled materials suppliers), then the implied required revenue is $700M–$1.17B annually.
Now compare to disclosed capacity:
End-2027 InP capacity: ~$65–70M/quarter = $260–280M annualized (100% utilization)
Add GaAs + Ge + raw materials (optimistic recovery): ~$100–150M
Total optimistic 2027 revenue: ~$360–430M
Gap:
Market-implied revenue: $700M–$1.17B
Capacity-supported revenue: $360–430M
This represents a 2–3× expectations gap. The current valuation does not price success — it prices dominance plus further scaling cycles that have not yet been announced, funded, or permitted. This is speculation on future speculation.
Note on forward P/S inconsistency: Some analyst commentary from late April 2026 cited a “forward P/S of ~8×”. If accurate, this would imply forward revenue of approximately $875M–$1.03B (using a $7–8B market cap), which is 2–3× higher than the maximum physically supported revenue based on disclosed 2027 capacity. This forward P/S figure appears either to use a much lower market cap (pre-rally), or to embed revenue assumptions that are inconsistent with management’s own capacity guidance. Investors should treat any sub-10× forward P/S claims with extreme skepticism unless the denominator (implied revenue) is explicitly verified against capacity constraints.
Peer Comparison
AXT’s primary listed comparable in the InP substrate space is Applied Optoelectronics (AAOI), another photonics infrastructure player. Broader comparables include Coherent (COHR) and Lumentum (LITE) as photonics device companies. As of current market pricing, AXT trades at a significant premium to any historical materials-company multiple, reflecting the speculative premium on the AI-optical infrastructure thesis.
Watchlist-Grade Valuation Requirement
The Watchlist standard requires at least a 20% discount to the 5-year median multiple. AXT’s 5-year median P/S was well below 5× (the company spent much of FY2023–2025 at P/S ratios below 2×). The current P/S of ~79× is not at a discount to historical medians — it is at an extraordinary premium of approximately 15–40× the historical average. This is a critical Watchlist violation: the valuation already prices in a highly optimistic execution scenario with little margin for error.
Price Opinion
OVERVALUED relative to fundamental value; priced for near-perfect execution of a still-unproven capacity ramp and sustained pricing power that may normalize as supply expands.
8. Entry Timing Assessment
Recent Price Action Context
AXTI has risen approximately 100× from its 52-week low of $1.32 to its all-time high of $132.48, with the most extreme move occurring in 2026. As of May 13, 2026, the stock closed near $128.81 with a daily range of $126.89–$129.49 — well extended from any historical support.
Additional volatility amplifier: The existence of AXTX — a Tradr 2× Long AXTI Single-Stock ETF — introduces nonlinear downside risk. Leveraged single-stock ETFs are empirically associated with volatility amplification and path-dependent drawdowns. In the event of adverse news (e.g., export permit delays, earnings misses, or geopolitical shocks), daily rebalancing flows from AXTX could exacerbate downward price moves, creating gap-down scenarios that exceed normal volatility expectations. Investors should be aware that standard stop-loss or exit disciplines may be insufficient to protect against gap risk when leveraged products are actively trading the same underlying stock.
Entry Condition Stack Assessment
Given the stock has appreciated approximately 100× in 12 months:
RSI recovery from oversold (<30): Almost certainly not met. After a 100× move with recent acceleration, 14-day RSI is virtually certain to be deeply overbought (likely above 70, possibly above 80). Without live RSI data confirmed, all four entry conditions are presumed unmet given the parabolic trajectory.
VWAP consistency: Unknown without live intraday data, but after a 100× move, the VWAP and daily close relationship may be inconsistent given extreme volatility.
Short-term trend (above 20-day MA): Likely met (stock above its 20-day MA given the uptrend), but this condition alone is insufficient.
Volume surge on 20-day MA clearance: Not assessable for the current moment.
Timing verdict: All four conditions are unlikely to be simultaneously met in a conventional sense at current price levels for a new entry. The framework’s intent — identifying oversold recoveries — is the opposite of the current situation. The framework would flag this as a timing exit condition (RSI above 80) for any existing holders, not an entry point.
Position Sizing Guidance
For investors already holding: The exit discipline (close if RSI > 80 or stock closes below 10-day MA on above-average volume) should be actively monitored. Given the presence of AXTX and extreme recent gains, consider tightening stops or taking partial profits to de-risk exposure.
For new entries: No framework-compliant entry signal exists at current prices. Investors seeking exposure should wait for a material pullback (ideally 30–50% from current levels) that would re-establish a margin of safety and allow entry conditions to reset.
9. Overall Assessment
Thesis Summary
AXT, Inc. sits at the intersection of two powerful secular forces: the AI data center infrastructure buildout and the structural shift from electrical to optical interconnects inside data centers. Indium phosphide wafers are a genuine bottleneck material in this transition — they enable the lasers and photodetectors that underpin silicon photonics-based optical interconnects at speeds that copper cannot match. AXT controls a significant share of global InP supply according to analyst estimates, has proprietary manufacturing technology, and is vertically integrated into raw materials. The Q1 2026 results and $100 million InP backlog represent a credible demand inflection, and the $632.5 million capital raise positions AXT to fund a multi-year capacity expansion.
The structural story is real. The question is not whether InP demand exists — it clearly does. The question is whether the stock already reflects the entire opportunity, and then some.
Key Risk Factors
Export permit timing risk is AXT’s most acute and immediate operational risk. Its manufacturing is in China, and Chinese government export permits are required to ship InP wafers. In Q4 2025, delayed permits caused revenue to undershoot guidance; in Q3 2025, obtaining permits drove a 250% sequential revenue surge. This binary, unpredictable variable can swing quarterly revenue by 30–50% and is entirely outside management’s control. As US-China geopolitical tensions evolve, this risk is asymmetrically negative.
Valuation risk is the most critical investment risk at current prices. A stock that has risen 100× in 12 months and now trades at 79× trailing sales — with a consensus analyst target implying 68% downside — has embedded expectations for flawless execution across multiple capacity doubling cycles, sustained InP pricing, and no geopolitical disruption. The capacity-vs.-expectations backsolve shows the market is pricing revenue 2–3× higher than what the disclosed 2027 capacity can physically support. Any one of these assumptions breaking would likely cause severe multiple compressions.
Customer concentration and geopolitical risk are intertwined. Approximately 86% of revenue comes from non-US customers; a significant portion of Chinese InP demand relates to Chinese domestic data center build-out, which is itself subject to US export control escalation. The recent expansion of US chip export controls creates a structural cloud over any China-dependent supply chain.
Dilution risk is material. The April 2026 equity offering of 8.56 million shares at $64.25, following a December 2025 offering of 8.16 million shares at $12.25, and the much larger Tongmei capital raise, collectively represent significant dilution to existing AXTI shareholders. The Tongmei listing on China’s STAR Market (still pending CSRC approval as of October 2025) introduces further structural complexity.
Execution risk is elevated because AXT has never before managed a capacity-doubling cycle of this magnitude. The manufacturing scale-up from approximately $18M per quarter (Q2 2025) to a targeted $35M per quarter InP run-rate by end-2026 requires perfect coordination across furnace installation, raw-material sourcing, yield management, and permitting.
Cycle risk: The compound semiconductor materials market has proven violently cyclical (–46% revenue in 2023). If the AI data center cycle moderates or inventory builds, AXT’s revenue could reverse sharply.
Leveraged ETF amplification risk (AXTX): The existence of a 2× leveraged single-stock ETF tracking AXTI introduces volatility amplification on both upside and downside. In the event of negative news, daily rebalancing by AXTX can create gap-down scenarios that exceed normal market volatility, making conventional exit discipline insufficient for risk management.
Investment Opinion
AXT, Inc. represents a compelling structural story — a genuine materials bottleneck in the AI optical infrastructure buildout — that is currently priced for perfection at a valuation that leaves no margin for error.
The sub-industry scores in Watchlist territory (67.9), the financial quality is in recovery but not yet restored (2/5), and the valuation is dramatically above the 20% discount to 5-year median multiples required for Watchlist-grade investments. The timing conditions for a new entry are not met.
This is not a classic bubble where the story is wrong. This is a timing mismatch where the story is early, but the valuation is late. The market has priced in a future capacity expansion cycle that has not yet been announced, funded beyond the initial $632.5M raise, or permitted. The gap between market-implied revenue ($700M–$1.17B) and capacity-supported revenue ($360–430M by 2027) is approximately 2–3×.
For investors who acquired the stock at earlier prices (below $10 or $20), the exit discipline of the framework (RSI >80 or close below 10-day MA on elevated volume) should be the governing risk management tool. Consider taking partial or full profits to lock in extraordinary gains.
For new investors, the framework does not support initiating a position at current prices, given the Watchlist sub-industry score, the unproven execution track record at scale, a valuation that reflects the optimistic scenario rather than a margin-of-safety scenario, and a consensus analyst price target 68% below current levels.
The story for AXT is not “Is InP demand real?” — it clearly is. The story is “Does the stock already reflect the entire InP opportunity, and then some?” At $128+ per share and a market cap of $7–8 billion against $88 million in trailing revenue and analyst targets averaging $41.33, the answer appears to be yes.
Overall Rating
WATCHLIST (Do Not Initiate at Current Prices)
Monitor for valuation normalization or correction that re-establishes a margin of safety. A pullback to the $40–$60 range (near consensus analyst targets) would bring valuation closer to fundamental support and allow for reassessment under more favorable risk/reward conditions.
Data sources: AXT 8-K filings (SEC.gov, October 2025; April 2026); AXT Q1 2026 Earnings Call Transcript (Motley Fool, April 30, 2026; BigGo Finance, April 30, 2026; Globe and Mail, April 2026); WallStreetZen AXTI revenue data (May 2026); Yahoo Finance income statement (May 2026); Robinhood AXTI quote (May 13, 2026); Investing.com AXTI quote (May 11, 2026); Public.com analyst consensus and price targets (May 15, 2026); WSTS Autumn 2025 Forecast (December 2025); WSTS Global Semiconductor Market Press Release, March 2026; SIA Global Semiconductor Sales Q1 2026 (May 2026); SEMI equipment billings forecast via Substack/Lapedus (December 2025); Benzinga photonics analysis (May 2026); Semiconductor-Today AXT Q3 2025 and Q4 2025 reports (November 2025; March 2026); StocksToTrade AXTI analysis (May 2026); Stifel hyperscaler capex estimate via Benzinga (May 2026); CNN Markets analyst ratings (May 2026); Barchart AXTI export permit analysis (April 2026). All data retrieved May 13–16, 2026.
Disclaimer: This analysis is for educational and informational purposes only and does not constitute investment advice. All investment decisions should be made with your own due diligence and, where appropriate, consultation with a qualified financial advisor. Past performance does not guarantee future results.