
Broadcom Inc. (AVGO) — Deep Analysis Report
The lock-in isn't legal — it's architectural. Here's what that means for the revenue you're underwriting at 32× forward earnings.

Semiconductor & Infrastructure Software | Compiled: May 13, 2026
Sources: SEC 8-K filings (FY2023–FY2025), Q1 FY2026 earnings release, Broadcom IR, GuruFocus, StockAnalysis, Morningstar, Investing.com, CNBC, Yahoo Finance, TrendForce, ChannelDive
1. Company Snapshot
Broadcom Inc. (NASDAQ: AVGO) is a fabless semiconductor and infrastructure software company headquartered in Palo Alto, CA. It designs custom AI accelerators (XPUs), Ethernet networking silicon (Tomahawk series), wireless connectivity chips, and enterprise software (VMware Cloud Foundation, CA Technologies, Symantec). As of May 13, 2026, Broadcom has a market cap of approximately $1.99–2.00 trillion, making it among the ten most valuable companies in the world. The stock trades at approximately $417–421 per share as of May 12–13, 2026, within a 52-week range of $221.60–$437.68.
Sub-industry classification: Broadcom is a complex hybrid. By FY2025 revenue, semiconductor revenue (~$39.3B of $63.9B total, ~61.5%) constitutes the dominant segment; infrastructure software (~$24.6B, ~38.5%) is a separate and structurally distinct profit pool. The dominant revenue stream classifies this as Fabless – AI/Custom XPU + Networking, but the software segment’s contribution to gross margin and FCF is materially higher than its revenue share implies and must be tracked as a distinct risk vector throughout this analysis.

2. Bottleneck Scorecard
Scoring Methodology
Four dimensions are scored 0–100 and weighted by structural importance to the investment thesis. A score below 30 on any single dimension triggers a catastrophic-weakness override, removing the Investable classification regardless of the total. All dimensions must be scored before the classification is issued.
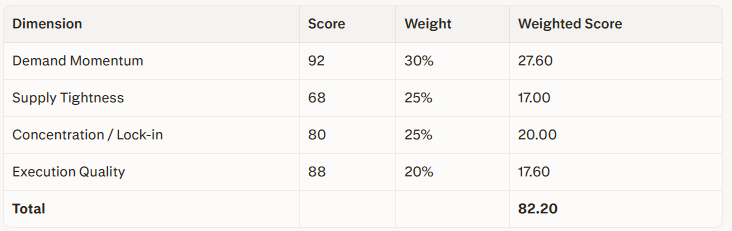
No dimension falls below 30. Catastrophic-weakness override: not triggered.
Classification: Investable. Proceed to full analysis.
Dimension 1 — Demand Momentum (92/100)
The five largest US hyperscalers have collectively committed between $660–725 billion in capex for 2026, nearly doubling 2025 levels, with roughly 75% directed at AI infrastructure. Global chip sales are on track to reach $1 trillion in 2026 after a 25.6% jump in 2025.
Broadcom’s Q1 FY2026 AI semiconductor revenue came in at $8.4 billion, representing 106% growth year-over-year — above the company’s own $8.2B guidance. For Q2 FY2026, Hock Tan guided AI semiconductor revenue to $10.7 billion, implying continued acceleration. The company has reaffirmed a long-term AI revenue target of $100 billion+ by FY2027, supported in part by the Anthropic-Google-Broadcom compute deal signed in April 2026, which alone could contribute an estimated $21 billion in AI revenue to Broadcom in 2026 and $42 billion in 2027, according to analyst estimates.
Score rationale: Demand momentum is the strongest in semiconductor industry history at this scale. Hyperscaler capex is growing >60% YoY into 2026; AI-specific chip demand is expanding on both unit and average selling price dimensions simultaneously. The score of 92 reflects this without overstating — execution risk on the demand side is negligible; the demand itself is contracted.
Dimension 2 — Supply Tightness (68/100)
TSMC’s advanced-node capacity (3nm, 2nm) remains constrained but is actively expanding. TSMC has raised CoWoS monthly capacity targets for 2026–2027, with estimates suggesting CoWoS capacity reaching 125,000 wafers per month by the end of 2026, representing annual growth of more than 70%. TSMC has committed $52–56 billion in capex for 2026, with 10–20% allocated to advanced packaging and testing, and advanced packaging revenue expected to exceed 10% of total TSMC revenue in 2026.
TSMC is also beginning to outsource lower-margin CoWoS-R and CoWoS-S processes to OSATs (ASE, SPIL, Amkor), whose combined CoWoS-like capacity is projected at ~40,000 wafers/month — a multiple-fold increase from 2024. TSMC’s CoPoS (Chip-on-Panel-on-Substrate) next-generation panel-level packaging pilot line is on track for completion by June 2026, with volume production expected in 2028–2029.
Score rationale: The supply bottleneck is real and has been structurally binding since 2023, but it is now clearly loosening rather than tightening. The 70% YoY capacity expansion at TSMC CoWoS is supply-side relief, not a supply-side constraint. A score of 68 reflects a supply environment that is tight-to-easing: Broadcom benefits from existing slot relationships but faces diminishing scarcity premium as capacity expands. This is the weakest structural dimension of the scorecard. Note: The Supply Tightness score has been revised slightly downward from the initial 70 to 68 to reflect the pace of capacity expansion confirmed by TrendForce and TMTPost data.
Dimension 3 — Concentration / Lock-in (80/100)
Structural lock-in (unaffected by credit risk): Broadcom and Google have entered a Long Term Agreement for custom TPU development and supply through multiple generations, plus a Supply Assurance Agreement for networking components through at least 2031. Meta has committed to a multi-generation XPU and networking roadmap with a first-phase commitment exceeding 1GW of custom silicon. Each XPU engagement requires 3–5 years of co-development across architecture, packaging, and interconnect — a customer who exits loses the accumulated roadmap co-investment. This switching cost is structural, not contractual.
Customer count: Hock Tan’s Q4 FY2025 earnings call confirmed four major XPU customers by name. Reports citing six total customers (adding Anthropic and Fujitsu) are derived from secondary analyst sources and have not been confirmed in Broadcom’s primary SEC disclosures or earnings transcripts. The four-customer figure is the defensible primary-source number; six should be treated as an unconfirmed upper bound pending further disclosure.
Counterparty credit sub-factor (score modifier: −5 points): The 5-point reduction from a structural score of 85 is attributable solely to counterparty credit risk concentrated in one customer — OpenAI. The architectural switching costs with Google, Meta, and ByteDance are entirely intact and carry no credit risk at that scale. The reduction reflects revenue certainty risk, not structural lock-in weakness. Even perfectly structured contracts cannot guarantee revenue delivery if the counterparty’s capital position deteriorates.
Dimension 4 — Execution Quality (88/100)
FY2025 total revenue was $63.9 billion, adjusted EBITDA $43.0 billion (+35% YoY), and free cash flow $26.9 billion — an FCF margin of approximately 42.1%. Capital spending was only $623 million against $27.5 billion in operating cash flow, representing strikingly low capital intensity for a company of this scale.
Q1 FY2026 confirmed execution continuity: revenue of $19.31 billion (+29.5% YoY), net income of $7.35 billion ($1.50/share GAAP, $2.05/share adjusted vs. $2.03 estimated), and Q2 FY2026 semiconductor guidance of $14.8 billion against a StreetAccount consensus of $13.06 billion — a meaningful beat-and-raise. Gross margin trajectory: semiconductor gross margin ~68% (up 70bps YoY); infrastructure software gross margin ~92.5% (up from ~88% prior year). Audit: Deloitte & Touche, no restatements, no material weaknesses, no going concern language in FY2024 or FY2025 10-K filings.
FCF quality check: FCF of $26.9B vs. GAAP net income of ~$23.1B in FY2025 = FCF/Net income conversion of approximately 1.16×, well above the ≥0.7× quality threshold. GAAP earnings do not overstate cash generation.
Score rationale: One of the most capital-efficient large-cap companies in the world at this revenue scale. The only historical knock — GAAP net income compression to 11.4% in FY2024 due to VMware integration charges — has fully reversed, with FY2025 GAAP net margin recovering to 36.2%. Execution is clean.
3. Business Model & Bottleneck Position
Broadcom controls two critical bottlenecks in the AI infrastructure stack: custom AI accelerator design and Ethernet networking silicon. It does not manufacture — TSMC does — but it owns the architectural IP that makes a working XPU viable for hyperscalers who lack the internal silicon engineering depth to execute alone.
The XPU business model operates as follows. A hyperscaler engages Broadcom to co-design a custom AI chip from scratch, contributing its own micro-architecture requirements while Broadcom provides design execution, 3.5D XPU packaging architecture (integrating compute dies, I/O tiles, and HBM in a single package), SerDes IP, and interconnect expertise. Broadcom earns revenue on every wafer shipped for the life of that chip generation — typically 3–5 years — making revenue recurring by design. The networking silicon business (Tomahawk series) operates on a separate but complementary model: Broadcom’s Tomahawk 6 switch at 102.4 Tbps has no comparable alternative for AI scale-out clusters at the top performance tier, and is sold alongside XPU deployments as a system-level solution.
The infrastructure software segment (VMware, CA Technologies, Symantec) operates on Hock Tan’s established playbook: acquire mature enterprise software assets, rationalize operating costs aggressively, force enterprise customers onto a consolidated platform (VMware Cloud Foundation), and collect the resulting subscription revenue at 92.5%+ gross margins. This is a cash extraction model, not a platform-growth model.
Upstream risk: TSMC (manufacturing), SK Hynix/Samsung (HBM memory). Broadcom does not control either bottleneck.
Downstream risk: Customer concentration — Google likely represents 30–40%+ of AI semiconductor revenue, though Broadcom does not disclose revenue by customer.
4. Financial Quality Analysis
Note: Broadcom’s fiscal year ends in late October/early November. FY2023 ended October 2023; FY2024 ended November 2024; FY2025 ended November 2025. Q1 FY2026 ended February 1, 2026.
Revenue Trajectory
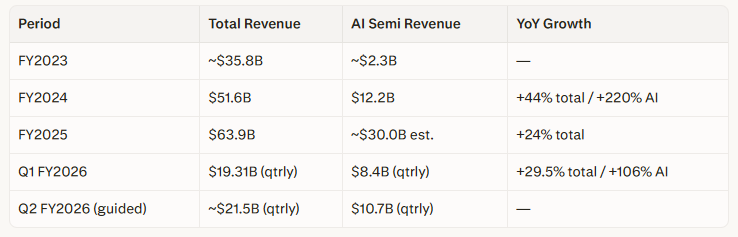
Q1 FY2026 annualised run-rate implies a minimum baseline of approximately $77B in total FY2026 revenue. However, Q1 is historically Broadcom’s strongest quarter relative to the fiscal year; this figure should be treated as a floor indicator, not a full-year forecast. Broadcom has not formally revised full-year FY2026 guidance to $77B+ as of Q1 reporting.
DuPont ROE Decomposition (3-Year)
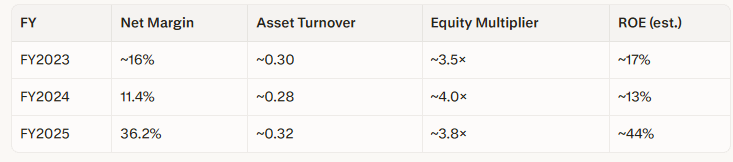
⚠️ Asset turnover and equity multiplier figures are directional estimates. Net margin figures are sourced from SEC filings and StockAnalysis. The FY2024 compression (VMware integration charges) and FY2025 recovery to 36.2% are confirmed from primary SEC filings. ROE figures should be treated as indicative, not precise.
Key Confirmed Metrics
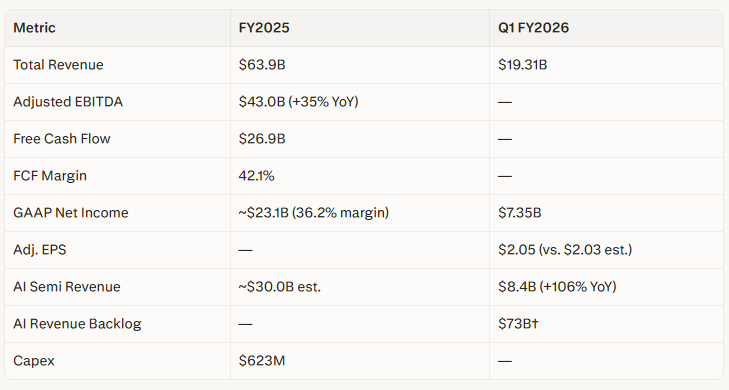
†The $73B AI backlog figure has not been formally disaggregated by Broadcom into contracted purchase commitments vs. estimated design-in pipeline value. Until Broadcom’s primary disclosures clarify the contractual status of this figure, it should not be treated as firm committed revenue. Treat as a forward revenue visibility indicator only.
Software Segment Margin Sensitivity
Infrastructure software at ~$24.6B of FY2025 revenue (38.5% of total) currently operates at ~92.5% gross margin. A 12-point gross margin compression — for example, from enterprise churn to Nutanix or Azure VMware Solution, accelerating beyond current rates — would reduce gross profit by approximately $3.0 billion, or roughly 11% of FY2025 FCF. This is not catastrophic to the overall FCF quality assessment, but it is material enough to merit explicit monitoring. The FCF narrative in this report does not assume software gross margin permanence; it flags this sensitivity as an ongoing risk vector. Current data indicates that while 86% of VMware customers are actively reducing deployments, only 4% have fully migrated off the platform, suggesting churn is gradual rather than acute.
Composite Financial Score: Top-quartile. FCF conversion (1.16×), gross margin trajectory, revenue growth acceleration, and audit cleanliness all score at the high end of framework criteria.
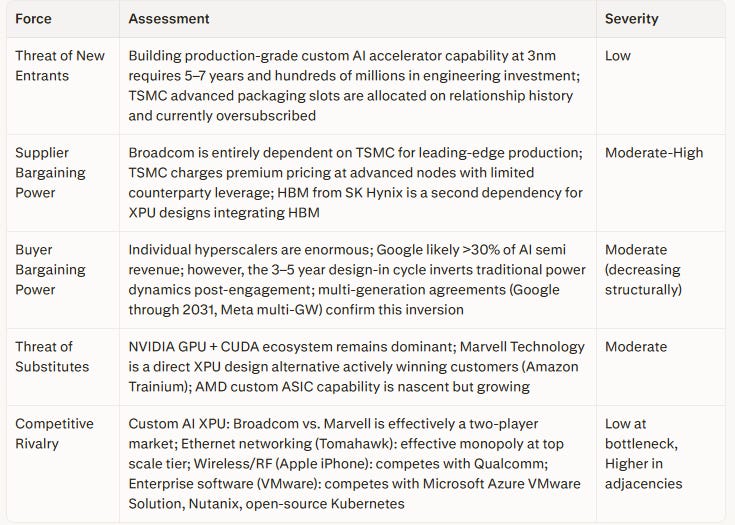
5. Competitive Position — Porter’s Five Forces
6. Moat Analysis
Broadcom’s moat is wide in semiconductors and narrow-to-medium in software, resting on four distinct pillars.
Pillar 1 — Proprietary Packaging IP: The 3.5D XPU platform integrating compute dies, I/O tiles, and HBM in a single package reduces time-to-silicon for hyperscalers by years. This is not replicable through hiring alone — it requires accumulated process knowledge developed through repeated TSMC CoWoS engagement cycles.
Pillar 2 — TSMC Advanced Packaging Slot Relationships: CoWoS capacity is allocated based on relationship history and forward commitments. Broadcom’s incumbency in TSMC’s allocation queue is a structural advantage that a new entrant cannot purchase.
Pillar 3 — Design-in Switching Costs: The 3–5 year co-development cycle per XPU generation means that a customer who exits mid-generation forfeits the entire accumulated roadmap investment. Google’s multi-generation TPU agreement and Meta’s multi-gigawatt commitment are the empirical evidence of this lock-in operating as designed.
Pillar 4 — Ethernet Networking Silicon Monopoly: Broadcom’s Tomahawk 6 at 102.4 Tbps is purpose-built for AI scale-out and has no comparable alternative at the top performance tier. AI data centers require both the XPU and the networking silicon — Broadcom’s ability to supply both creates a system-level bundling advantage.
Software moat assessment: The VMware moat is a cash extraction moat, not a platform innovation moat. Hock Tan forced enterprise customers onto VMware Cloud Foundation at significantly higher per-core pricing, generating the 92.5% software gross margin. This is durable over 3–5 years as migration friction remains high, but Gartner has noted that half of enterprises are expected to initiate proofs of concept for VMware alternatives within two years, and William Blair research estimates up to 30% of VMware’s 400,000+ customer base will eventually migrate. The software moat is durable in the near term; fragile over a 7–10 year horizon.
7. Valuation Analysis
Lifecycle stage: Late-growth / early-maturity on semiconductors; mature on software.
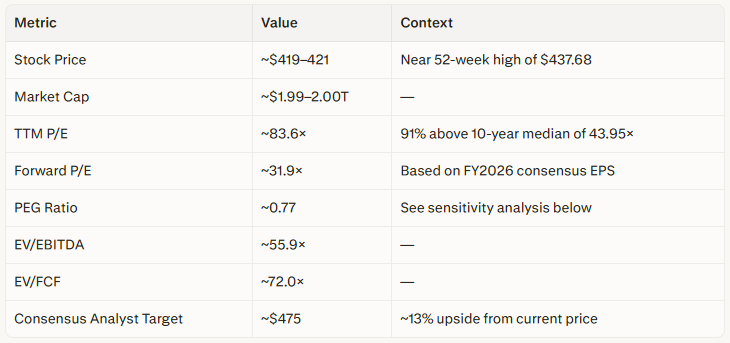
Current Multiples (May 12–13, 2026)
Historical P/E Context
The 10-year median P/E for AVGO is 43.95×. The current TTM P/E of ~83.6× is 91% above that median. The 5-year average P/E is approximately 52×. Trailing P/E is an unreliable primary metric for a company undergoing a step-change in earnings — the FY2024 GAAP net income compression from VMware integration charges artificially elevated the TTM P/E at that time, and the FY2025 recovery makes the trailing multiple appear elevated on a normalization basis. Forward P/E is the more relevant metric for current valuation assessment.
Morningstar Fair Value Assessment
Morningstar’s current DCF fair value estimate is $142 per share. At ~$420, AVGO trades at approximately 3× Morningstar’s intrinsic value model. The Morningstar 5-star buy price of $414 and 1-star sell price of $382 reflect an extreme uncertainty-adjusted band within their rating system — these are not alternative fair value estimates but price thresholds calibrated to Morningstar’s uncertainty classification for this name. The correct interpretation: the stock is priced for near-flawless execution on the AI pipeline and offers no DCF-based margin of safety. The 5-star price of $414 means Morningstar considers even a buy signal at that level to be a high-uncertainty proposition, not a value entry.
PEG Sensitivity — Break-Even Analysis
At a forward P/E of ~32×, the stock is fairly valued by the PEG heuristic only if FY2026 GAAP EPS grows by at least 32% annually. Current consensus embeds approximately 40% EPS growth for FY2026. If the OpenAI Titan revenue delay scenario materialises and consensus growth is revised from 40% to 28%, the PEG crosses above 1.0 to approximately 1.14, removing the “fairly valued relative to growth” argument entirely. This 32% break-even growth rate is the single most sensitive near-term valuation metric in the report. The consensus target of $475 implies only ~13% upside — an insufficient margin of safety when the downside scenario from OpenAI delay involves meaningful multiple compression.
Peer Valuation Comparison
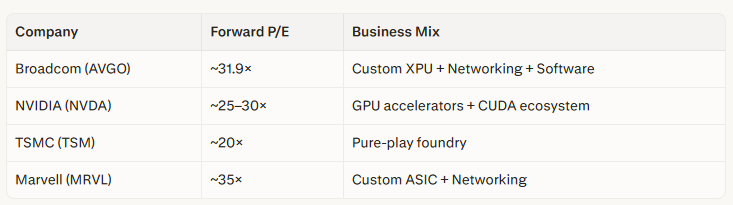
On a forward basis, AVGO is not materially more expensive than its closest peers. The valuation premium is concentrated in the trailing multiple, which reflects the FY2024 earnings trough from VMware integration rather than a structural re-rating.
Price opinion: Fairly valued to modestly overvalued on a 12-month basis; potentially undervalued on a 3-year basis if the $100B+ AI revenue target is achieved. The Morningstar DCF anchor strongly reinforces that the market is pricing in a multi-year scenario with minimal error tolerance.
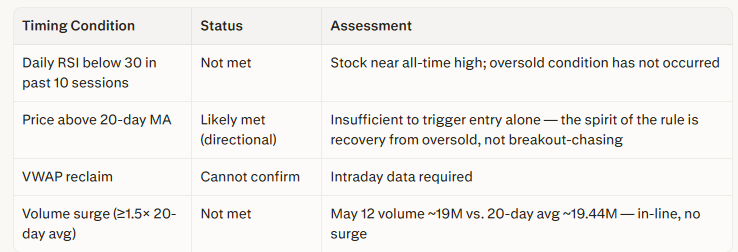
8. Entry Timing Assessment
As of May 12–13, 2026, the stock is trading near its 52-week high of $437.68, approximately 90% above the 52-week low of $221.60. The stock has returned approximately 139% over the past year. All four timing conditions are assessed below.
Exit trigger specification:
Close position if the daily RSI closes above 80
Close position if the stock closes below its 10-day MA on above-average volume on the daily chart
Monitor weekly RSI for context when the stock is near all-time highs — weekly RSI above 80 while daily RSI is below 80 indicates elevated distribution risk even without a daily trigger
Timing verdict: All four entry conditions are not currently met. A 30–40% starter position (not exceeding 2.5% of a diversified portfolio) is defensible given the Investable scorecard classification and top-quartile financial quality. A full-position entry at current prices is not supported by the timing framework.
9. Risk Hierarchy
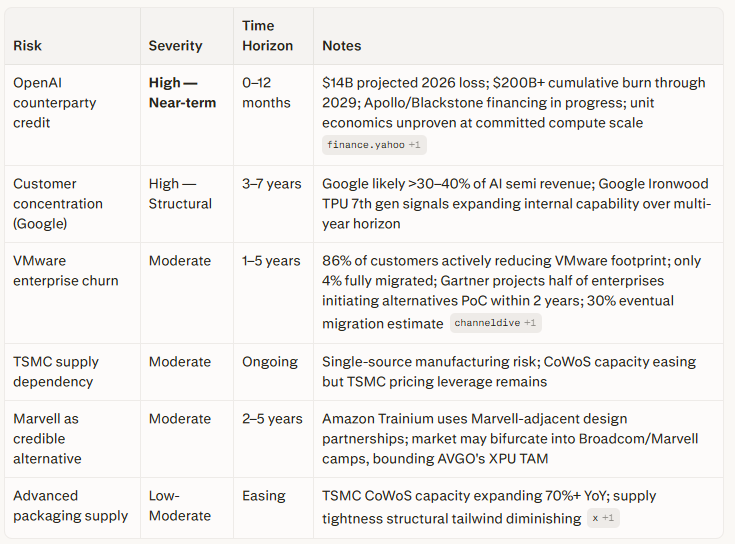
OpenAI Risk — Detailed Assessment
The $18 billion financing obstacle for the Titan 1 XPU project is the proximate risk; the structural risk runs deeper. OpenAI is projected to lose approximately $14 billion in 2026 and is expected to accumulate operational losses exceeding $200 billion through 2029. The Apollo and Blackstone debt financing discussions introduce capital market conditionality into what was modeled in analyst consensus as a direct, predictable customer revenue stream.
Critically, OpenAI has not demonstrated that its AI service business can achieve sustainable unit economics at the compute scale it is committing to. If OpenAI’s restructuring into a for-profit entity changes capital allocation priorities — or if Microsoft Azure contract terms shift — the Titan 1 revenue stream for Broadcom faces multi-layer risk that extends beyond the current financing round. Jefferies analyst Blayne Curtis has penciled in $10 billion+ of Titan 1 revenue by H1 2027; if Titan volumes are delayed by even one quarter, the FY2026 AI growth story and the 40% EPS growth embedded in the PEG calculation both require downward revision.
10. Overall Assessment
Bull Case
Broadcom has built the most defensible custom AI accelerator franchise outside of NVIDIA, with multi-year contractual lock-in at the world’s largest AI spenders. The customer-by-customer demand stack is visible: Google’s TPU pipeline is running at $70B+ annualised Cloud revenue growing 48% YoY; the Anthropic-Google-Broadcom compute deal could deliver $21 billion in Broadcom AI revenue in 2026 alone, rising to $42 billion in 2027; Meta’s first gigawatt arrives in 2027; and OpenAI’s Titan 1 — financing obstacles notwithstanding — remains a $10B+ revenue opportunity if it deploys at volume. Q2 FY2026 guidance of $10.7 billion in AI semiconductor revenue alone confirms the acceleration trajectory. The FCF machine is exceptional, the balance sheet is sound, and Hock Tan’s 15-year track record of disciplined capital allocation is a consistent execution anchor.
Bear Case
The trailing P/E at 91% above the 10-year median is a genuine valuation risk. Morningstar’s DCF model places fair value at $142 — the stock is trading at 3× that estimate, pricing in a scenario of near-flawless execution with no margin of safety. Google simultaneously represents >30% of AI semiconductor revenue and is expanding its own internal silicon capability (Ironwood TPU 7th generation) — a 5–7 year structural threat that the market is not pricing. OpenAI’s financial instability introduces near-term revenue uncertainty into the single most high-profile growth story in Broadcom’s AI pipeline. VMware churn, while gradual today, is directionally accelerating and erodes the software gross margin story that underpins the FCF multiple.
Investment Opinion
Broadcom is a high-conviction Investable sub-industry at the bottleneck scorecard level (82.20/100), with top-quartile financial quality and a wide moat in custom AI XPU design. On a 3-year time horizon, the revenue pipeline from committed hyperscaler customers is visible, contracted, and structurally reinforced by design-in switching costs — the current forward valuation is justifiable if execution holds. On a 12-month time horizon, the stock is near all-time highs with timing conditions not met, a PEG break-even requiring 32%+ EPS growth, and the OpenAI credit risk as an unresolved catalyst all warrant restraint.
Position sizing: Maximum 2.5% of portfolio. Total semiconductor exposure capped at 20%. A 30–40% starter position within that ceiling is defensible; full-position sizing at current prices requires accepting that price action is running well ahead of both the timing framework and the DCF-based margin of safety.
Exit triggers (daily chart):
Daily RSI closes above 80
Stock closes below 10-day MA on above-average volume
Bottleneck scorecard score falls below 50 at next quarterly re-scoring
Monitor weekly RSI independently — weekly RSI above 80 is a distribution risk indicator even if daily triggers have not fired.
Maintenance triggers for mandatory re-score:
Q2 FY2026 earnings release (July/August 2026)
Apollo/Blackstone OpenAI financing close or collapse (binary event)
TSMC CoWoS capacity update materially above or below the 125,000 wafer/month end-2026 estimate
This analysis is for educational and informational purposes only and does not constitute investment advice. All investment decisions should be made with your own due diligence and, where appropriate, consultation with a qualified financial advisor. Past performance does not guarantee future results.