
Figure Technology Solutions (FIGR) — In-Depth Financial Analysis Report
The marketplace take-rate is scaling fast—but the cash conversion is still catching up.

Report compiled June 11, 2026. Data sourced from SEC EDGAR (10-K, 10-Q, 8-K filings), company investor relations (quarterly earnings press releases), and third-party financial aggregators (StockAnalysis.com, SimplyWallSt, Investing.com, MacroTrends). Valuation percentiles based on post-IPO trading range (IPO: September 2025). Market prices as of approximately June 1, 2026.
Chapter 0: Flash Card
Q1 2026 (latest): Net Revenue $167M (+97.6% YoY), Net Income $45M (27% margin), Adj. EBITDA $82.7M (49.6% margin), Marketplace Volume $2.9B (+112.6% YoY)
| Profit Quality | Medium-High (rapidly improving; one quarter of Q4 2025 EPS miss signals volatility) | | Cycle Environment | Neutral-to-Tailwind (rate plateau benefits HELOC demand; blockchain regulatory clarity improving) | | Moat Rating | Moderate (first-mover blockchain infrastructure with growing network effects; still HELOC-concentrated) | | Current Valuation | P/E (TTM) ~47–78x (depending on earnings definition); ~65.28% below consensus $53.88 target; historical percentile HIGH | | Key Risks (Top 3) | 1. HELOC/housing cycle sensitivity; 2. Regulatory risk on blockchain/stablecoin; 3. Kiavi acquisition integration + valuation execution risk | | Investment Summary | Early-stage transition from balance-sheet lender to capital-light marketplace; explosive growth and improving profitability are real, but the valuation implies near-perfect execution. The Kiavi acquisition ($717M, announced June 10, 2026) is transformative but adds complexity. Not a value play — a growth-at-a-premium story. |
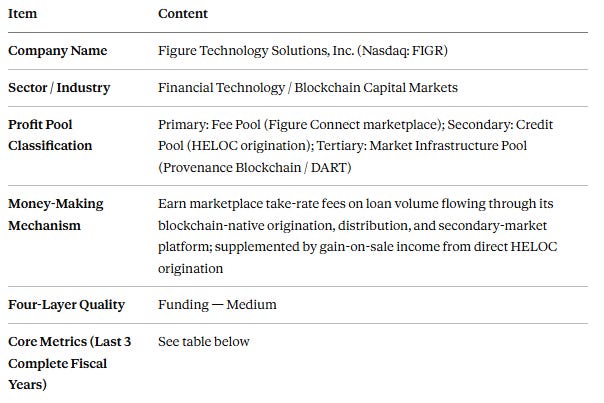
I. Company Overview
Figure Technology Solutions, Inc. (Nasdaq: FIGR) is a blockchain-native capital marketplace headquartered in New York, operating primarily in the United States. The company connects loan origination, funding, and secondary-market activity through its proprietary Provenance Blockchain infrastructure, with the Home Equity Line of Credit (HELOC) market as its founding product.
IPO Date: September 11, 2025, at $25/share (raised $787.5M, priced above range)
Current Stock Price: ~$33.41 (as of June 1, 2026)
52-Week Range: $25.01 – $78.00
Market Capitalization: ~$7.6–8.1B (mid-cap)
Shares Outstanding: ~220.5M
Ticker: Nasdaq: FIGR (also OPEN: FGRS for blockchain shares)
CEO: Michael Tannenbaum; Executive Chairman: Michael Cagney (co-founder of SoFi)
Profit Pool Mix (Approximate FY2025):
Fee Pool (marketplace take-rate, Figure Connect): ~35–40%
Credit Pool (HELOC gain-on-sale, origination): ~50–55%
Market Infrastructure (Provenance Blockchain, DART registry, servicing): ~5–10%
 Price (rFIGR) in USD - Live Updates | Coinranking")
II. Business Model & Profit Pool Positioning
2.1 Profit Pool Classification & Core Mechanism
Figure sits at the intersection of three profit pools, with its strategic narrative centered on transitioning away from capital-heavy balance-sheet lending (Credit Pool) toward the far more valuable capital-light marketplace toll-booth model (Fee Pool + Infrastructure Pool).
One-sentence mechanism: Figure earns marketplace take-rate fees and gain-on-sale income by originating, distributing, and facilitating secondary trading of tokenized loans — primarily HELOCs — across its Provenance Blockchain infrastructure, while monetizing the network through software licensing fees (LOS), stablecoin float ($YLDS), and increasingly, digital asset brokerage.
Profit Pool Breakdown:
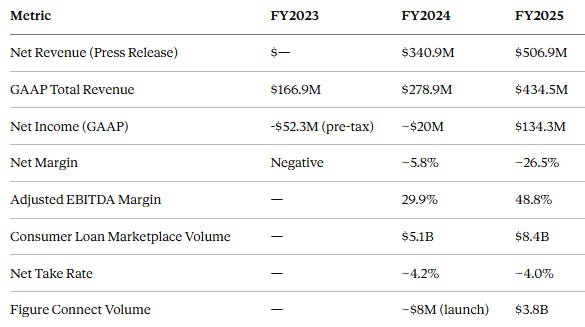
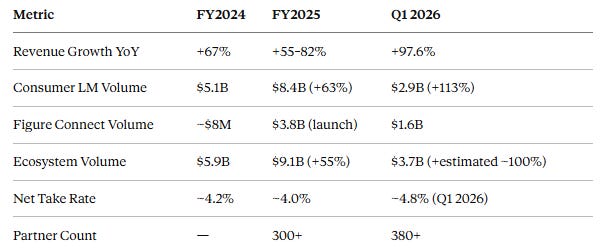
Fee Pool (Primary, growing): Figure Connect is the company’s electronic marketplace for peer-to-peer loan trading and distribution. It earned a net take rate of ~4.0% on $8.4B of Consumer Loan Marketplace volume in FY2025. The shift to marketplace economics is the core valuation thesis — Figure Connect processed $3.8B of volume in FY2025 (launched mid-2024), scaling to $1.6B in Q1 2026 alone (56% of total marketplace volume).
Credit Pool (Secondary, shrinking as % of revenue): Direct-to-consumer HELOC origination remains the volume engine but is being displaced by third-party B2B2C origination. Figure claims #1 non-bank HELOC market share in the US, with 380+ origination partners. Gain on sale of loans, interest income during the hold period, and securitization execution are the primary revenue drivers. The company executed the first AAA-rated securitization of blockchain assets and has originated over $25B in home equity loans cumulatively.
Market Infrastructure Pool (Early-stage): Provenance Blockchain (layer-1 proof-of-stake protocol) and DART (Digital Asset Registry Technology, a blockchain-based lien registry) are positioned as financial plumbing. $YLDS — the first SEC-registered yield-bearing stablecoin — carries $598M in circulation as of Q1 2026 and could become a significant fee pool on its own. Democratized Prime (on-chain warehouse lending) and the Figure Exchange (regulated crypto brokerage) round out this segment.
2.2 Four-Layer Deconstruction & Quality Ratings
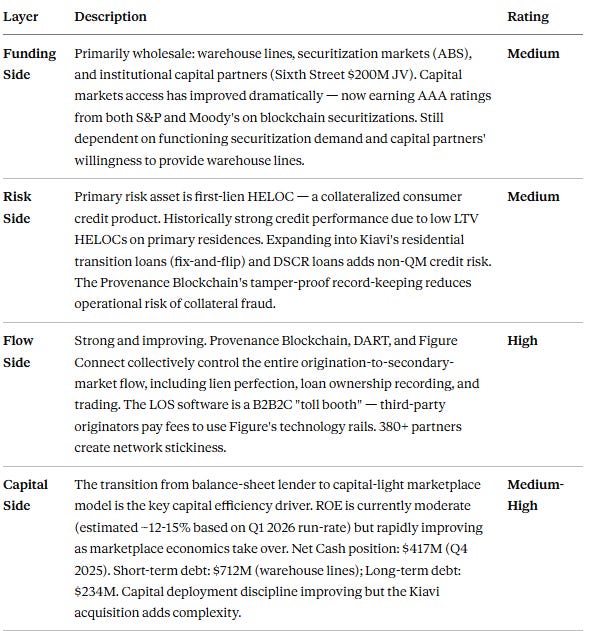
2.3 Upstream/Downstream Relationships & Bargaining Power
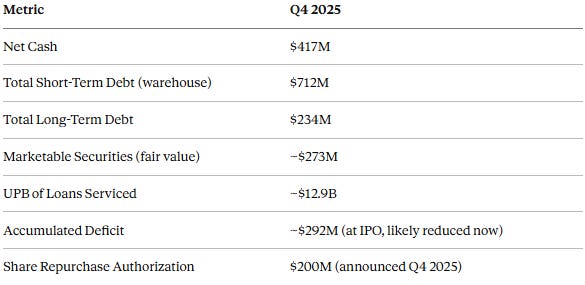
Upstream (funding/capital providers): Moderate-high bargaining power. Sixth Street is both a strategic partner and a capital provider — this dual relationship creates some dependency risk. AAA securitization ratings provide access to diverse institutional buyers, reducing single-counterparty risk. Warehouse lines (short-term debt $712M) need rolling renewal, a standard risk for non-bank lenders.
Downstream (borrowers & partner originators): Growing bargaining power over partners as the network effect builds. The LOS platform’s embedded nature (covers HELOC origination workflow end-to-end) creates switching costs. However, in the consumer HELOC market, borrower price sensitivity is high; rate competition from banks and credit unions remains intense. Take rates (4.0% net) are significantly above traditional capital market execution costs, justified by speed (10 days vs. 40+ days) and liquidity.
III. Financial Statement Analysis
3.1 Profitability
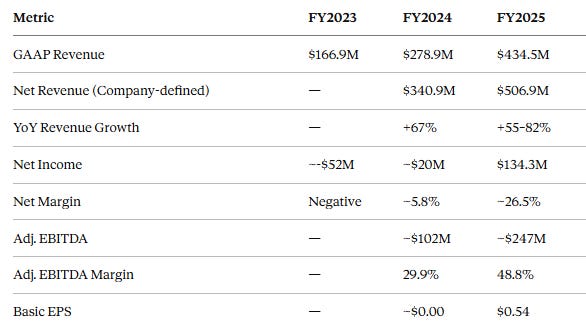
Q1 2026 Update: Net Revenue $167M (+97.6% YoY); Net Income $45M (27% margin); Adj. EBITDA $82.7M (49.6% margin); Basic EPS $0.21. Q4 2025 EPS of $0.07 missed consensus $0.13 — the primary cause of the ~35% drawdown from January to May 2026 highs.
Revenue trajectory analysis: The company went through a dramatic P&L inflection point. From chronic losses in FY2022-2023 (accumulated deficit of ~$292M at June 2025), the business pivoted to sustained profitability in H2 2024, driven by: (a) growth in marketplace take-rate revenue (high margin), (b) operational leverage as the fixed-cost base is now spread across much higher volume, and (c) improvement in gain-on-sale pricing through the blockchain securitization advantage.
ROE and ROTE: Not directly disclosed, but back-calculated estimates suggest ROE of approximately 12–15% on a Q1 2026 annualized basis (net income ~$180M annualized / equity estimated at ~$1.2B). This is improving but still modest relative to the premium valuation. Importantly, if the Fee Pool transition succeeds, the capital-light nature of marketplace revenue should drive ROE expansion without proportional equity growth.
3.2 Growth
Revenue growth is accelerating as the marketplace model scales. The Kiavi acquisition (announced June 10, 2026) will add $7B+ in annual origination volume to Figure Connect, potentially doubling the marketplace scale and supporting the FY2026 guidance of $718M revenue.
3.3 Financial Health & Risk Metrics
Credit quality: As a HELOC-focused lender, Figure’s loan portfolio is first-lien, home-equity secured. Non-performing loan data is limited in public disclosures, but HELOC credit quality has historically been strong. The expansion into residential transition loans (Kiavi) will introduce higher-risk, shorter-duration credit assets that require different underwriting and cycle management.
Liquidity: Adequate. Net Cash of $417M plus $200M warehouse capacity from Sixth Street JV and broader capital markets relationships. The $717M Kiavi deal will strain the balance sheet unless financed efficiently — most of the loan assets are going to a Sixth Street/Figure JV (balance-sheet risk sharing), while Figure pays for Kiavi’s technology and operating platform.
3.4 Cash Flow & Profit Quality
Operating cash flow as of Q4 2025: ~$62.6M (TTM per StockTitan). This is significantly lower than reported net income ($134M), which is a key yellow flag. The divergence partly reflects:
Non-cash items in net income (fair value gains, equity-based compensation)
Working capital changes related to loan origination/hold period
Timing differences in gain-on-sale recognition
Profit Quality Rating: Medium. Net income has grown dramatically, but the OCF/Net Income ratio is below 1.0x, suggesting some reliance on fair-value-based gains (particularly on marketable securities) within reported earnings. The Q4 2025 EPS miss (actual $0.07 vs. $0.13 expected) also revealed lumpiness in earnings recognition. The Adjusted EBITDA of 48.8% is impressive but excludes significant SBC and other items.
A positive note: the trajectory is right — Q1 2026 shows OCF improvement as marketplace fees (cash-settling) displace balance-sheet gain-on-sale (timing lag).
3.5 Audit Opinion
Based on publicly available 10-K/10-Q filings (SEC EDGAR), Figure Technology Solutions has received standard unqualified clean audit opinions. No qualified, adverse, or disclaimed opinion has been identified. Analysis proceeds.
IV. Competitive Analysis (Porter’s Five Forces)
4.1 Barriers to Entry — HIGH
Figure has constructed a multi-layer moat around its blockchain infrastructure:
Regulatory licenses: State-by-state mortgage lending licenses, a regulated securities exchange (Figure Exchange), and SEC registration for $YLDS stablecoin. These represent years of compliance work and capital expenditure.
Provenance Blockchain: A purpose-built, layer-1 blockchain for financial assets. Competitors cannot simply “plug into” Figure’s settlement infrastructure. Building a competing chain with equivalent institutional credibility, security, and regulatory recognition would take years.
Network effects: With 380+ partners originating on Figure’s rails and $25B+ cumulative originations, the liquidity of Figure Connect improves with scale. Originators come because buyers are there; buyers come because originators bring quality flow.
DART Registry: Blockchain-based lien perfection is a compelling value proposition for the 1,000+ county recorders who currently process paper liens. First-mover advantage here is significant.
Capital requirements: Building a functional HELOC securitization program (warehouse lines, rating agency relationships, ABS investor base) is capital- and time-intensive.
4.2 Industry Competitive Landscape — MODERATELY FRAGMENTED
The HELOC market is large (~$2T addressable across consumer credit) and dominated by large banks (Chase, Wells Fargo, Bank of America) in the conventional segment. The non-bank HELOC market — where Figure operates — is smaller and more fragmented. Figure claims #1 non-bank market share.
Direct fintech competitors include SoFi (SOFI), Spring EQ, and Hometap. But Figure’s infrastructure-layer positioning is more analogous to marketplace operators like LoanCore, Blend, or Ellie Mae (now ICE Mortgage Technology) than to pure consumer lenders. The blockchain angle has no direct peer — this is a genuine first-mover position in blockchain-based capital markets.
The figure represents ~75% of real-world asset (RWA) tokenization activity on public blockchains (per company claims). While this is an early market, the lead is growing.
4.3 Threat of Substitutes — MEDIUM
Traditional capital markets (agency GSE execution for mortgages; conventional ABS) remain the dominant route for most originators, but they are slower and costlier for non-agency assets.
Other blockchain platforms (Centrifuge, Maple Finance) exist for credit tokenization but lack Figure’s institutional relationships, regulatory approvals, and ABS track record.
Rate normalization (lower rates) could shift demand toward mortgage refinance (agency-eligible), reducing HELOC demand — a macro substitute risk rather than a competitive one.
AI-driven direct lending platforms (Upstart) are indirect substitutes for consumer credit broadly.
4.4 Upstream Bargaining Power — MEDIUM
The figure is dependent on capital market conditions, warehouse lending rates, and investor appetite for non-agency ABS. The Sixth Street JV provides some insulation, but in a credit crunch or risk-off environment, spreads widen, and warehouse lines may become more restrictive. The company is working to diversify its capital base with 300+ institutional buyers on Figure Connect, which reduces single-counterparty dependency.
4.5 Downstream Bargaining Power — IMPROVING
The B2B2C model (partners using Figure’s technology to originate their own branded loans) creates deep integration — banks and credit unions that have built their HELOC workflows on Figure’s LOS cannot switch easily without disrupting their customer relationships. The 380-partner count and growing network effects suggest that downstream bargaining power is moving in Figure’s favor. However, larger partner banks retain leverage due to volume significance.
Competitive Rank within Pool: Top third of non-bank marketplace lenders in the US; early leader in blockchain-native capital markets.
V. Policy & Industry Environment
5.1 Monetary Policy & Interest Rate Cycle — NEUTRAL TO TAILWIND
The Federal Reserve has signaled a plateau in the rate cycle as of mid-2026. HELOC demand is inversely correlated with mortgage refinance volumes — in a high-rate environment, homeowners are “rate-locked” into their mortgages and turn to HELOCs for liquidity instead. This has been a structural tailwind for Figure’s growth. Any Fed rate cuts would further stimulate HELOC origination by lowering the cost of the credit line.
Spread compression is a risk if short rates drop faster than HELOC pricing adjusts, but the marketplace fee model insulates Figure from NIM compression — Figure earns a take-rate on volume regardless of the absolute rate level.
5.2 Regulatory Policy Developments — MIXED
Blockchain/Crypto regulation: The SEC’s approval of $YLDS as the first registered yield-bearing stablecoin is a major regulatory milestone and signals growing acceptance of blockchain-native financial products. However, future regulatory action on stablecoins (e.g., the Lummis-Gillibrand framework, potential Federal Reserve oversight) could impose additional compliance costs.
Non-bank mortgage regulation: FHFA and CFPB oversight of non-bank lenders has intensified. Stricter capital requirements or servicing rules for non-bank mortgage servicers could raise operating costs.
Tokenized RWA: Gaining regulatory attention — the SEC, OCC, and Treasury have all published frameworks. Regulatory clarity appears to be improving rather than tightening, which is a tailwind for Figure’s infrastructure.
5.3 Macro & Credit Cycle — NEUTRAL
US housing values remain elevated, supporting HELOC collateral quality. Consumer balance sheets are holding up, supporting HELOC credit performance. The key macro risk is a housing price correction — a 10%+ decline in home values would simultaneously increase defaults, reduce LTV coverage, and reduce borrowers’ available equity for new HELOC originations.
5.4 Policy Environment Judgment — NEUTRAL TO TAILWIND
Primary variable 1: Fed rate trajectory (rate cuts would accelerate HELOC demand but may compress margins slightly). Primary variable 2: Stablecoin/RWA regulatory framework (clarity = tailwind; restrictive rules = headwind).
VI. Moat Analysis
6.1 Intangible Assets (Licenses / Brand / Data)
Licenses: State mortgage licenses, SEC-registered securities exchange, and SEC-registered stablecoin issuer (a first for the industry). These took years and significant legal/compliance investment to secure.
Proprietary technology: Provenance Blockchain (layer-1), DART (lien registry), Adaptor (AI-driven agentic onboarding announced with Kiavi deal). The blockchain infrastructure is not patented in the traditional sense but is deeply embedded in the workflows of 380+ partners.
Data: Six years of blockchain-based loan origination data (origination patterns, default rates, prepayment speeds) across $25B+ in home equity loans. This dataset is unmatched in the non-agency HELOC space and supports better AI-driven credit models and securitization pricing.
6.2 Customer Stickiness (Switching Costs / Network Effects)
Switching costs for partners are HIGH: A bank that has integrated Figure’s LOS into its mortgage processing workflow, trained staff, and built capital markets relationships through Figure Connect faces significant operational disruption to switch. This is analogous to the stickiness of legacy core banking systems.
Network effects on Figure Connect are GROWING: The marketplace becomes more liquid with each new originator or capital buyer. The $1.6B in Q1 2026 Figure Connect volume (56% of total) demonstrates rapid adoption — network effects are now clearly visible in the data.
6.3 Cost Advantage (Scale / Regional)
Figure’s blockchain infrastructure claims 85 basis points in cost savings versus traditional ABS execution. This is a structural cost advantage that improves as securitization volume scales. The proprietary LOS also reduces HELOC closing costs and timelines (10 days vs. 40+ days), making Figure-originated loans more attractive to borrowers on the cost of capital dimension.
6.4 Unique Resources
First-mover in RWA tokenization at scale: ~75% of all public blockchain RWA activity. This is a compounding advantage.
Sixth Street Capital Partnership: Provides patient, strategic capital that most fintech competitors cannot access.
Founder pedigree: Michael Cagney (co-founder of SoFi) brings proven fintech scaling credibility, which aids partner and institutional investor relationships.
$YLDS stablecoin: SEC-registered, yield-bearing stablecoin with $598M in circulation. A potential franchise asset in the growing tokenized deposit market.
Moat Width Rating: MODERATE — Blockchain infrastructure moat is real and growing, but HELOC revenue concentration means the moat’s value depends heavily on sustained housing market health and rate environment. The transition to capital-light marketplace economics (which widens the moat meaningfully) is underway but not yet complete.
VII. Valuation Analysis
7.1 Valuation Metric Selection & Rationale
The figure is primarily a Fee Pool business in transition from Credit Pool economics. Given:
The marketplace/platform component (capital-light, high-margin recurring fee income): P/E is the primary valuation anchor, with P/S and EV/EBITDA as supplementary metrics.
A P/B approach is not appropriate for the Fee Pool component, though it may provide a floor given the balance sheet.
Given the recent switch to profitability and earnings growth rate of ~50%+ consensus, a PEG ratio analysis is also warranted.
7.2 Current Valuation Level
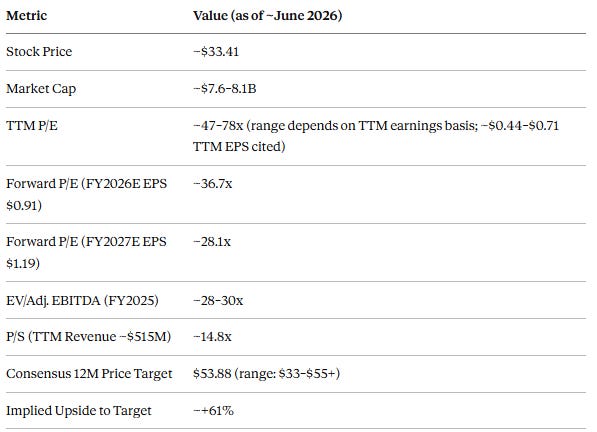
Historical Percentile: Figure only IPO’d in September 2025, so meaningful historical percentile data is limited. The stock peaked at $78 (January 2026) and has since corrected ~57% from those highs, trading back near IPO +34% from the $25 offering price. The current price represents a significant de-rating from peak multiples, offering a more rational entry point versus January 2026 valuations.
Note: BofA maintains an Underperform rating with a $33 target; Mizuho targets $55; 8 analysts average $53.88 “Buy” consensus. This is a high-dispersion analyst setup.
7.3 Peer Comparison within the Same Profit Pool
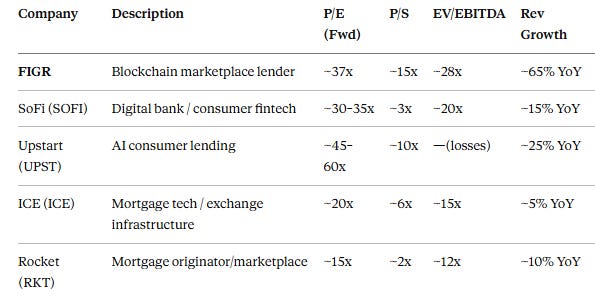
Figure trades at a significant premium to all peers on nearly every metric, reflecting the unique blockchain infrastructure story and superior revenue growth rate. The premium is partially justified by the 65%+ revenue growth, but the P/S of ~15x vs. ICE’s 6x or RKT’s 2x reflects either structural mispricing or a genuine recognition of Figure’s long-term addressable market.
7.4 PEG Valuation
Forward P/E (FY2026E): ~37x
Consensus EPS CAGR (FY2025–FY2027): ~$0.54 → $1.19 = ~48% CAGR
PEG Ratio = 37 / 48 = 0.77x
A PEG of 0.77x is below 1.0x, suggesting the stock may be undervalued on a growth-adjusted basis relative to its earnings trajectory — a bullish signal. However, this PEG calculation is heavily sensitive to whether analyst growth forecasts materialize. The Q4 2025 EPS miss demonstrates that quarterly earnings can be volatile.
7.5 Institutional Expectations & Forward Valuation
Consensus FY2026 guidance from Figure: Consumer Loan Marketplace volume of $3.8–4.1B in Q2 2026 alone. FY2026 full-year revenue guidance: ~$718M (consensus); EPS ~$0.91. FY2027E: Revenue ~$904M; EPS ~$1.19.
The Kiavi acquisition (announced June 10, 2026) will add $7B+ in annual origination volume. If this closes as expected, it will likely prompt upward revisions to FY2026/2027 estimates, potentially re-rating the forward P/E lower.
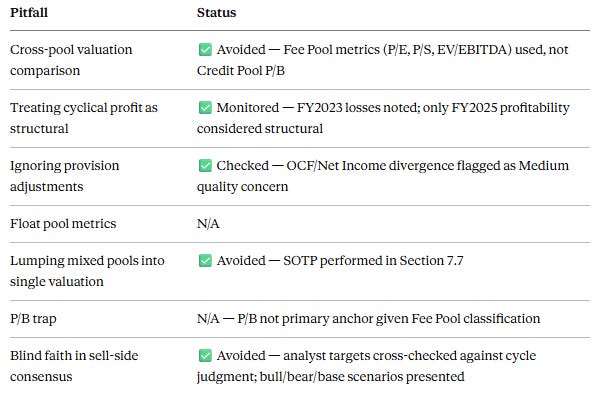
Cross-check against Pitfall Table: These consensus forecasts assume continued rapid marketplace adoption, sustained housing market activity, and successful Kiavi integration. The cycle judgment from Step 4 (Neutral-to-Tailwind) is broadly consistent with these forecasts, but the estimates carry more execution risk than typical for a mature financial company. No pitfall violation identified.
7.6 Entry Price Judgment — FAIR TO SLIGHTLY UNDERVALUED vs. GROWTH SCENARIO; OVERVALUED vs. CONSERVATIVE SCENARIO
At ~$33.41:
Bull case: PEG of 0.77x, 60%+ upside to analyst targets, Kiavi acquisition adds volume, blockchain RWA market expands — stock is meaningfully undervalued. Target P/E of 40x on FY2027E EPS of $1.19 = ~$48. Fair value ~$48–55.
Base case: Growth materializes but with execution friction; P/E re-rates to 30x on $1.00 EPS in FY2027 = ~$30. The current price is roughly fair.
Bear case: Kiavi integration disappoints, housing market softens, blockchain regulation tightens; FY2026 EPS comes in at $0.65 = multiple compresses to 25x = ~$16. Significant downside remains possible.
Range of interest (educational reference only): $28–35 represents a reasonable zone given current fundamentals. Below $28, the growth-at-any-price premium erodes to a more defensible level.
7.7 Mixed Pool SOTP Valuation
Given the Figure’s mixed pool nature:
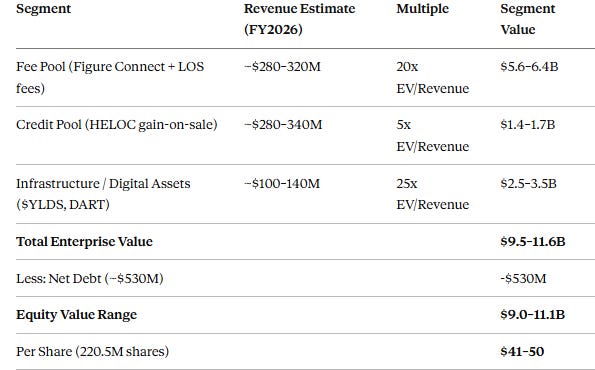
SOTP suggests current ~$33.41 offers potential upside to the mid-$40s, though the infrastructure segment valuation assumes $YLDS and DART achieve commercial scale.
VIII. Key Risk Matrix
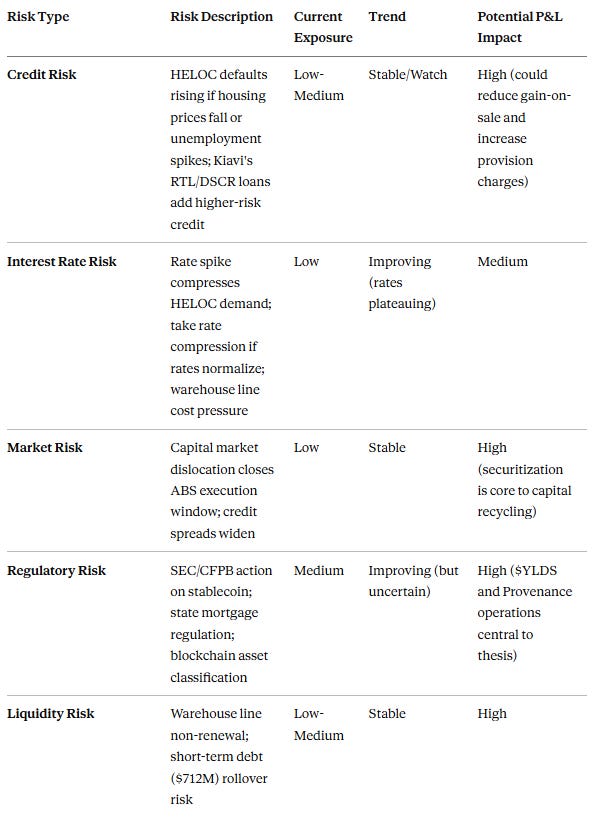
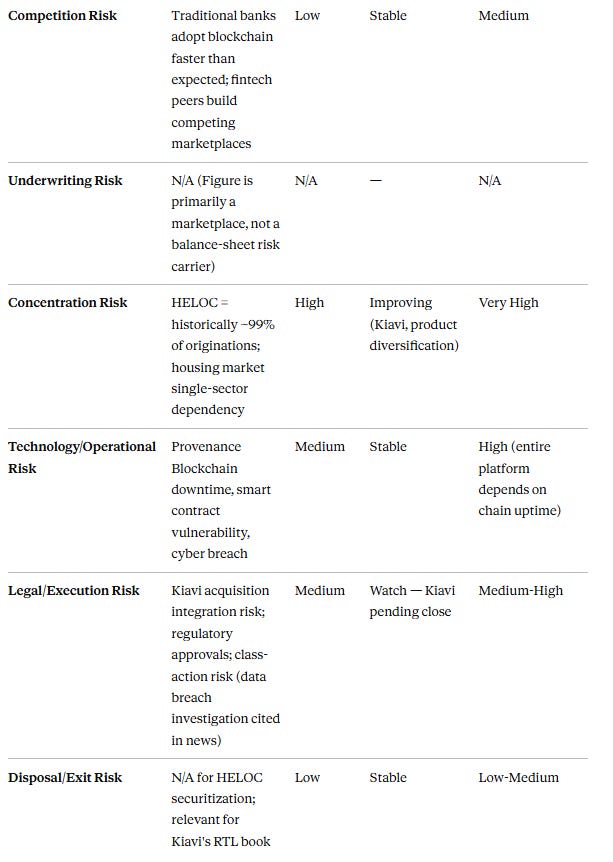
Special note: A data breach class-action investigation by Lynch Carpenter was reported in June 2026. This is a material risk to monitor.
IX. Comprehensive Assessment
Profit Pool Quality & Cycle Position
Figure Technology Solutions occupies an enviable strategic position: a first-mover in blockchain-native capital markets at the precise moment when institutional adoption of tokenized real-world assets is accelerating. The business has evolved from a balance-sheet HELOC lender (lower quality, capital-intensive Credit Pool) to a capital-light marketplace operator (higher quality Fee Pool + Infrastructure Pool). This transition is what drives the premium valuation — and it is genuinely supported by the data.
FY2025 profitability was a clear inflection — from a loss-making company to a $134M net income performer. Q1 2026 continued the momentum with 97.6% revenue growth and 27% net margin. Cycle position is Neutral-to-Tailwind given rate plateauing.
Moat Width Rating: MODERATE (trending toward Wide)
The blockchain infrastructure moat — Provenance, DART, Figure Connect — is real and growing. The 380+ partner network, first-mover RWA tokenization position (~75% market share), AAA securitization track record, and SEC-registered stablecoin ($YLDS) are genuine competitive advantages. However, the moat is still fragile in one dimension: HELOC/housing concentration means a housing shock could impair both volumes and asset quality simultaneously. The Kiavi acquisition and expansion into mortgages, auto, and personal loans is the right diversification strategy, but it takes time to reduce this concentration risk.
Probability of Sustained Future Excellence: Medium-High
The platform flywheel is clearly engaged — more partners → more volume → better marketplace liquidity → attracts more partners. Revenue growth of 60%+ with improving margins and a growing network effect makes it plausible that Figure could become the “Nasdaq for non-agency credit” over the next 5–10 years. The risk is execution: the Kiavi integration, blockchain scaling, regulatory evolution, and competitive response from large banks all require near-flawless management.
Key Risk Points (Top 3)
HELOC/Housing concentration: Any meaningful housing correction would simultaneously hurt volumes, credit quality, and valuation. This is the single most important macro risk.
Regulatory risk on blockchain/stablecoin: The company’s entire infrastructure thesis depends on continued regulatory goodwill toward tokenized finance. A hostile regulatory shift would be a structural threat.
Kiavi acquisition execution risk: The $717M deal (just announced June 10, 2026) adds $7B in annual volume but also integration complexity, new credit risk (RTL/DSCR loans), and financial strain during the transition period.
Common Pitfall Check
Investment Suggestion (Educational Reference Only)
Figure Technology Solutions is a high-quality growth story with genuine first-mover advantages, trading at a fair-to-slightly-discounted valuation relative to its growth trajectory following the ~57% drawdown from January 2026 highs. The PEG of 0.77x, 60%+ analyst upside to consensus target, and SOTP analysis suggesting mid-$40s fair value all support a constructive view at current levels (~$33).
However, this is decidedly not a value investment — it is a growth-momentum play where execution risk is high, earnings can be lumpy, and the housing/rate macro environment must cooperate. For conservative investors, the concentration risk, data breach investigation, and Kiavi integration uncertainty are meaningful concerns that warrant caution or staged position-building.
Suggested monitoring catalysts:
Kiavi acquisition close and integration milestones (H2 2026)
$YLDS circulation growth (currently $598M; watch for $1B+ milestone)
Q2 2026 earnings (guided $3.8–4.1B marketplace volume — a beat/miss will be highly market-moving)
Regulatory developments on blockchain/stablecoin (any adverse action is a sell signal)
This analysis is for educational reference only and does not constitute any investment advice. Markets involve risk; invest with caution.