
Lyft, Inc. (NASDAQ: LYFT) — Deep Analysis Report
A 19% FCF yield sounds like a gift. It’s mostly insurance float—and a market that’s pricing a survival question, not a compounder.

Data As Of: June 21, 2026 (Q1 2026 10-Q is the latest filed quarter; FY2025 10-K is the latest annual filing) | Currency/Standard: USD, US-GAAP
1. Company Snapshot
Lyft is a North American (and, since mid-2025, European) ridesharing marketplace connecting riders and drivers through its mobile app, supplemented by bikes/scooters, the Express Drive vehicle-rental program (operated through its wholly-owned subsidiary Flexdrive), advertising (Lyft Media/Lyft Ads), and — following 2025 acquisitions — European taxi-aggregation (FREENOW) and licensed/chauffeur services (Gett’s UK business). Business Model Classification: Take-Rate Marketplace (Tier 6), AI-Enabled Marketplace (dynamic pricing, ETA/dispatch matching, fraud detection), with an emerging but not-yet-triggered “Marketplace Autonomous Supply Transition” theme (AV trips are currently a rounding error of Gross Bookings, well under the framework’s 20% trigger threshold).
Market Cap / Price: ~$5.6B at $14.26/share (June 20, 2026); 52-week range $12.46–$25.54; ~395–400M shares outstanding after sustained buybacks (down from ~424M a year earlier).
Gross Bookings (FY2025): $18.5B (+15% YoY). Take Rate: ~34% (definitional caveat, §4.4c). Adjusted EBITDA Margin (% of GB): 2.9% (Contribution-Margin proxy; true Contribution Margin no longer separately disclosed, see §4.1).
Core Vertical: Ridesharing/Transportation-as-a-Service (rideshare, taxi-aggregation, executive/chauffeur, car-sharing, bikes/scooters).
Key Operating Geographies: US and Canada (core, ~95%+ of FY2025 Gross Bookings); since 2H 2025, Ireland, UK, Germany, Greece, Spain, Italy, Poland, France, and Austria via FREENOW, plus Gett’s UK taxi/chauffeur business (closed Q1 2026).
EU Revenue Share: Low (likely well under 15% even post-FREENOW, given the US/Canada base dominates Gross Bookings) — the EU Data Act switching-cost analysis is therefore not material, and in any case is largely inapplicable to consumer marketplaces (see §5.6).
 - Alpha Spread")
2. Business Model & Tech Stack
2.1 Products & Services
Lyft’s core product is a two-sided ridesharing marketplace: demand-side riders request trips through the Lyft app; supply-side drivers (independent contractors) accept and fulfill them. Adjacent products include Lyft Bikes & Scooters (owned hardware, minor revenue), Express Drive (Flexdrive-operated short-term vehicle rentals for drivers who don’t own qualifying cars), Lyft Media (an early-stage, fast-growing but still small advertising business embedded in the rider/driver apps), and Lyft Healthcare (non-emergency medical transportation, integrated into provider EHR workflows via a 2026 partnership). The FREENOW and Gett UK acquisitions add a taxi-first, multi-mobility layer in nine-plus European countries, diversifying Lyft beyond pure rideshare into licensed-taxi aggregation, which the company argues carries a different (often higher Gross-Bookings-per-ride) economic profile than North American rideshare.
2.2 Deployment & Revenue Model
Mobile-app-based marketplace (iOS/Android), web booking for some products. Revenue Model: Take-Rate % (Marketplace), layered with Delivery/Service Fee components and a small but growing Advertising/Ancillary stream (Lyft Media). Lyft does not currently operate a major demand-side subscription tier comparable to Uber One/DashPass — this is a structural moat and monetization gap versus its primary competitor (see §6.2).
2.3 Target Customers, ACV Proxy, GTM Motion
Demand side: individual consumers booking point-to-point and multimodal trips, increasingly including health systems (via the Lyft Healthcare/Epic integration) and a newly launched “Lyft Teen” product targeting the 13–17 age cohort’s ~15B annual personal-vehicle-trip addressable pool in the US. Supply side: independent-contractor drivers, plus (since 2025) licensed taxi drivers in Europe. ACV Proxy: Annualized Gross Bookings per Active Rider ≈ $18.5B / 51.3M ≈ $361/year, placing the overwhelming majority of Lyft’s demand base in the “Light” tier (<$500/year) of the framework’s marketplace ACV-proxy schema — consistent with rideshare being an occasional-use rather than daily-habit product for most riders. GTM motion: Demand-Led, supplemented by partnership-driven acquisition (Lyft reported ~27% of North American rides in Q1 2026 were linked to a partnership — Chase, DoorDash, United Airlines, etc. — a meaningfully cost-efficient distribution channel that substitutes for a subscription program).
2.4 Upstream Dependencies & Concentration
Lyft depends on AWS for cloud infrastructure, third-party payment processors, mapping/navigation data providers, background-check vendors, and — critically — its own wholly-owned insurance subsidiary for substantially all US auto-related liability risk (a long-standing, capital-intensive structural feature of the rideshare model that materially affects cost-of-revenue volatility; see §3.6). As a B2C marketplace, customer concentration is not a relevant risk (no single rider or driver approaches a material share of Gross Bookings). Geographic concentration remains high: the US/Canada core still represents the large majority of Gross Bookings, notwithstanding the European expansion, which is a geographic-diversification positive in direction but still small in absolute scale (FREENOW added an estimated ~€1B of annualized Gross Bookings at acquisition, versus Lyft’s ~$18.5B total).
2.5 Tech Stack & Technical Debt Score
Lyft’s platform is cloud-native and continuously deployed; the company maintains an active advertising/data engineering function (Lyft Media) and has integrated multiple third-party AV stacks (May Mobility, Waymo via Flexdrive fleet operations in Nashville, Baidu’s Apollo Go for UK/Germany testing, and a 2027-target hardware partnership with Tensor) rather than building a proprietary AV stack — a capital-light but also moat-light strategic choice. Technical Debt & Engineering Culture proxy score: 6/8 — modern architecture, frequent app updates, generally reliable core transaction/payment/safety systems, though public engineering-blog/community visibility is modest relative to larger tech peers. This does not independently support a wide-moat case, but is not a red flag either.
2.6 Business Model Comprehensibility Self-Assessment
(a) Lyft creates value by matching idle driver supply with rider demand and captures value as a percentage-of-fare marketplace fee. (b) The two most critical non-financial variables: (i) driver supply elasticity/retention relative to Uber’s driver-side economics, and (ii) the rate of multi-homing among both sides of the market, which determines how much of Lyft’s “local network effect” is real versus illusory. (c) Which side is harder to acquire/retain: supply (drivers) — Lyft’s own disclosures (e.g., a claimed “23-point dual-app driver preference” in Q1 2025) implicitly concede that a large share of its drivers also drive for Uber, meaning Lyft is competing for marginal driver hours/utilization rather than for exclusive driver relationships. Liquidity does not unambiguously beget more liquidity in a high-multi-homing environment, because added driver supply on Lyft’s app also strengthens Uber’s app for the same physical driver. The take rate (~34% reported, ~25–28% on a comparable economic basis to Uber once accounting differences are normalized) is sustainable in the near term, given improving unit economics, but faces dual pressure from competitive intensity (multi-homing) and regulatory risk (worker classification, algorithmic-pricing scrutiny).
2.7 Lifecycle Position
Using the Marketplace lifecycle thresholds (>$10B Gross Bookings, positive and expanding Contribution-Margin proxy, double-digit GB growth = Mature & Stable), Lyft sits at the boundary between Scale-Up and Mature & Stable: Gross Bookings comfortably clear $10B and margins are expanding every year, but the absolute margin level (2.9% of GB) remains well below what a “mature, stable” marketplace would be expected to sustain (Uber’s comparable margin is 4.6% and still rising). Lifecycle Transition Status Flag: Yes — Lyft is in a self-described “comeback”/margin-expansion phase with explicit 2027 targets (Adjusted EBITDA margin ~4% of GB by 2027, GB CAGR ~15% 2024–2027, FCF conversion >90% of Adjusted EBITDA each year 2025–2027). Per the framework’s relaxation provision, temporary margin softness associated with the European expansion (FREENOW integration costs, reportedly near-term EBITDA-dilutive per management commentary) should not be read as structural decline, provided the 2027 targets are reaffirmed each quarter — a 6-month recheck point is set for this report (December 2026).
3. Competitive Landscape & Tech Disruption
3.1 Porter’s Five Forces (Marketplace-Adapted)
Threat of New Entrants: Low-to-moderate. The “cold start” problem (must acquire both riders and drivers simultaneously) remains a real barrier, but it is a barrier that protects the category (Uber + Lyft) rather than protecting Lyft specifically from Uber. The more relevant new-entrant threat is vertically-integrated AV operators (Waymo, Tesla) who could, in principle, bypass the marketplace layer entirely by owning both the “driver” (vehicle) and the demand-capture app.
Rivalry Intensity: Regional oligopoly bordering on winner-takes-most in North America; Lyft is a distant #2 to Uber on Gross Bookings (Uber’s quarterly run-rate of ~$54B dwarfs Lyft’s ~$4.9–5.4B, an order of magnitude difference even after adjusting for Uber’s multi-vertical Delivery/Freight mix). In Europe, Lyft enters as a sub-scale new entrant against Uber, Bolt, and Gett’s remaining European operations, with FREENOW as its primary local-share asset.
Threat of Substitutes / Disintermediation: Moderate. Lyft’s insurance, payments, background-check, and dispute-resolution infrastructure raises the cost of off-platform transacting for casual riders, but the dominant substitution risk is intra-category substitution to Uber (via multi-homing) rather than disintermediation to direct driver-rider arrangements. AV bypass is the more structurally dangerous substitute: if Waymo (which already operates its own branded robotaxi app, “Waymo One,” and recently introduced a “Waymo Premier” loyalty tier per June 2026 reporting) expands without needing either Uber’s or Lyft’s marketplace layer, both incumbents face disintermediation — but Lyft, with less AV scale and partnership breadth, is more exposed.
Supplier Power (Drivers): Elevated and rising. California’s AB 1340 (effective January 1, 2026) grants certain high-activity gig drivers collective-bargaining rights without reclassifying them as employees — a novel regulatory structure that could increase driver-side bargaining power and per-trip costs without triggering the binary “reclassification” shock the framework treats as a hard-stop-adjacent risk. New Jersey’s newly finalized ABC-test regulations (effective October 2026) further raise reclassification risk in at least one state where Lyft has already settled a $19.4M misclassification claim (2014–2017 period).
Buyer Power (Riders): High. Riders face near-zero switching costs and, per industry-standard estimates and Lyft’s own driver-side commentary about dual-apping, a large share of the demand base also has Uber installed. A June 2026 Consumer Reports investigation into AI-driven, individualized fare-setting at both Uber and Lyft adds a fresh reputational/regulatory dimension to buyer-power and pricing-fairness risk.
3.2 Product & Innovation Initial Judgment
Tech & Development expense efficiency (Tech expense / incremental Gross Bookings) is not separately broken out by Lyft with enough granularity for a precise ratio, but qualitatively, the company’s R&D has shifted from core marketplace features (matching, ETA, fare guarantees for drivers) toward AV-integration engineering (in-app surfacing of partner AV trips) and advertising-platform build-out. Safety & reliability: Lyft discloses periodic safety transparency reports; no recent grounding or mass-recall events identified in this research window.
3.4 Competitor Relative Benchmark (Lyft vs. Uber)
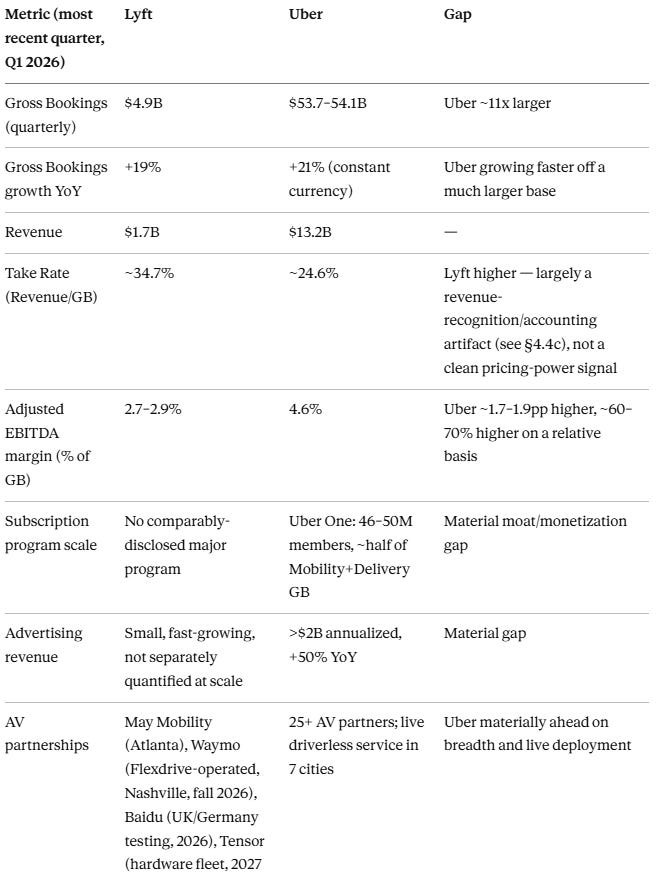
Judgment per Step 2.5 rule: Lyft trails Uber by 1.7–1.9 percentage points on Adjusted-EBITDA-margin-as-Contribution-Margin-proxy — under the framework’s explicit 10pp hard-trigger for “Relative Competitive Disadvantage,” but the relative gap (Lyft’s margin is roughly 60% of Uber’s) combined with the much larger gaps in subscription penetration, advertising monetization, and AV breadth is enough, in this analyst’s judgment, to flag “Relative Competitive Disadvantage” as a standalone risk even though the single dictated pp-threshold is not technically breached. This judgment call is disclosed transparently per the framework’s execution principle.
3.5 Competitive Dynamics Reassessment Trigger Record
No reassessment-triggering event (competitor financing/acquisition >$1B, major new AI/AV capability surpassing the company, etc.) has occurred in the 30 days before this report beyond the ongoing, already-priced-in AV partnership announcements discussed above. Note for future tracking: Uber’s May 2026 acquisition of Voi (~$1B) and ongoing AV partner expansion should be monitored as a potential trigger for the next quarterly reassessment.
4. Financial Data Verification
4.1 Core P&L Metrics — Three-Year Trend
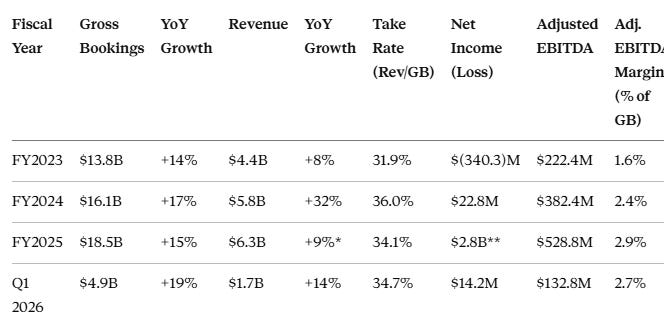
*FY2025 revenue growth was suppressed by a one-time $168M Q4 2025 charge tied to legal, tax, and regulatory reserve changes/settlements; ex-charge, Q4 revenue growth would have been ~13% and full-year growth modestly higher. This is exactly the kind of “non-recurring item recurring across periods” pattern the framework’s revenue-quality checklist flags for scrutiny (§4.8). **FY2025 GAAP net income of $2.8B is not representative of operating profitability — it is inflated by a deferred-tax valuation-allowance release. The clean operating profitability proxy is Adjusted EBITDA ($528.8M, 2.9% margin).
Important Clarification — Contribution Margin vs. Adjusted EBITDA Margin: Lyft stopped formally disclosing Contribution and Contribution Margin starting Q4 2023, electing instead to anchor external communication to Gross Bookings, Active Riders, Rides, and Adjusted EBITDA margin (% of GB). Per the framework’s explicit guidance, Adjusted EBITDA margin is a more conservative proxy than true Contribution Margin because it nets out corporate overhead, R&D, and D&A that a pure unit-economics Contribution Margin would not subtract. This means Lyft’s underlying per-trip unit economics are very likely healthier than the 2.7–2.9% of GB headline figure suggests, but the magnitude of the gap cannot be precisely quantified from public disclosures — flagged as an uncertainty notch increase per the framework’s data-downgrade protocol.
Marketplace Gross Margin (Revenue − Cost of Revenue ex-incentives, as a % of Revenue): Q1 2026 gross margin was reported at ~43.2%, below the framework’s “>70% healthy” software-company anchor but in line with the structural reality that rideshare marketplaces carry payment-processing, insurance, mapping, and driver-related costs of revenue that are far heavier than a pure-software platform’s COGS. This is a category-wide characteristic, not Lyft-specific weakness; Uber’s comparable gross margin runs in a similar band.
4.2 Growth & Retention Metrics (Marketplace Adaptation)
Lyft does not separately disclose demand-side or supply-side retention rates with the granularity the framework’s NRR/GRR-analogue calls for. Proxy data: Active Riders grew to 51.3M for full-year 2025 (record), with Q4 2025 Active Riders +18% YoY to 29.2M and Q1 2026 Active Riders +17% YoY to 28.3M — six consecutive quarters of double-digit Active Rider growth, a reasonable proxy for healthy demand-side retention-plus-acquisition combined. Rides reached 945.5M for FY2025 (+14%), an all-time high, with eleven consecutive quarters of double-digit YoY growth as of Q4 2025. No independently sourced Multi-Homing Index figure exists for Lyft specifically, but third-party industry surveys and Lyft’s own driver-side commentary (referencing “dual-app drivers”) strongly suggest demand-side multi-homing well above the framework’s 50% “high” threshold in the US rideshare category generally. This is marked “Assumed Proxy” with increased uncertainty and is treated as a moat-scorecard input in §6.6 rather than as a precisely measured figure.
4.3 Unit Economics Depth
Marketplace Rule of 40 proxy (GB growth + Adjusted EBITDA margin): FY2023 ≈ 14+1.6=15.6; FY2024 ≈ 17+2.4=19.4; FY2025 ≈ 15+2.9=17.9; Q1 2026 ≈ 19+2.7=21.7. All years fall well short of 40, though the trend is one of gradual, not yet adequate, improvement. Cohort Payback Period, Supply Acquisition Cost & Payback, and Incentive Spend Ratio are not disclosed with sufficient granularity post the 2023 metric-presentation change; downgraded to qualitative judgment — management commentary suggests incentive intensity has declined as a strategic priority (the FTC’s 2024 enforcement action against Lyft for “deceptive earnings claims,” settled for $2.1M, and the subsequent move to cap Lyft’s platform fee at 30% in 2026, both point toward a more transparent but margin-constrained driver-pay structure rather than aggressive promotional subsidy).
4.4c Marketplace-Specific Financial Metrics — Take Rate Benchmark Reconciliation
Lyft’s reported take rate (~34–36% across FY2024–FY2025) sits well above the framework’s Granular Take Rate Benchmark matrix for “Ride-hailing, US/Canada (Mature)” of 22–28%. Per the framework’s investigation protocol for above-benchmark take rates, the explanation here is definitional, not a pricing-power signal: Uber’s revenue recognition nets certain driver-payment and insurance costs against revenue as “contra-revenue” (explicitly confirmed in Uber’s own Q1 2026 prepared remarks, which describe a “movement of driver payment costs from cost of revenue to contra-revenue” affecting reported margins by ~400bps), whereas Lyft’s revenue construct includes a larger share of these flows gross, with insurance and driver-payment costs run through cost of revenue rather than netted against revenue. Investors and the framework’s own analysts should not treat Lyft’s higher headline take rate as evidence of superior monetization versus Uber; the cleaner cross-company comparison is Adjusted EBITDA margin (% of GB), where Uber leads (§3.4).
4.4d — Hybrid Marketplace+1P Segment Metrics: Not Applicable. Lyft is classified as a pure Take-Rate Marketplace; Flexdrive (vehicle rental) and Lyft Bikes/Scooters are supply-side enablement tools and minor owned-hardware lines respectively, not a material first-party retail segment in the sense the framework’s Hybrid Marketplace+1P sub-type contemplates. No sum-of-parts valuation decomposition is required.
4.6 Customer Base Quality Migration Tracking
Geographic Mix Quality: The FREENOW/Gett European expansion is, by design, a deliberate strategic diversification rather than an organic mix-shift signal, but it does carry the framework’s flagged risk that new/developing markets can depress blended Contribution Margin via higher initial incentive and integration spend — consistent with reported commentary that FREENOW will be near-term EBITDA-dilutive during integration. Product Mix Shift: Lyft’s core remains rideshare; the European taxi-aggregation mix (FREENOW reportedly ~90% taxi-fare bookings) carries different, often higher, Gross-Bookings-per-ride economics than North American rideshare, per company disclosure, though take-rate-on-taxi-fares in regulated European taxi markets may differ from rideshare take rates — a nuance requiring further disclosure to fully model.
4.8 Revenue Quality Detective Checklist (Quick Results)
DSO Spike: Not observed; rideshare payment processing remains near-instant. No flag.
Deferred Revenue Decline + Concentration Rising: Not applicable in the same form as SaaS; no major subscription deferred-revenue base to monitor (itself a flag of the missing-subscription-program gap noted elsewhere).
Revenue/User-Count Divergence + Weak Retention: Active Riders (+17–18%) and Gross Bookings (+15–19%) have moved in a reasonably consistent band; no major divergence flag.
Capitalized Software Dev / R&D >30%: Not independently verified from available disclosures in this research window — flagged as a data gap requiring 10-K footnote review.
Non-GAAP Adjustments Increasing Without Explanation: Flag raised. The Q4 2025 $168M “legal, tax, and regulatory reserve changes and settlements” charge, layered on top of a multi-year history of insurance-reserve-related non-GAAP adjustments (Lyft revised its non-GAAP calculation methodology in late 2022 following SEC guidance on insurance reserve treatment), represents a recurring pattern of large, judgment-dependent reserve items affecting reported results. This is the single most important revenue-quality watch item in this report and merits explicit tracking each quarter going forward.
4.9 Agent/Robot (Autonomous Supply) Economy Revenue Capture Assessment — High Timeliness, Annual Review Required
Mandatory Checklist:
AV-specific pricing tier disclosed? Not yet publicly detailed by Lyft beyond the general framing that AV trips will flow through the existing marketplace and that Lyft will earn a marketplace/fleet-management-style fee — qualitatively similar to Uber’s articulated approach with Waymo. Answer: Partial/No (directional intent stated, no published tier).
Non-Human/AV authentication and dispatch architecture support? Yes in principle — the Flexdrive-operated Nashville AV launch (using Waymo vehicles, opening fall 2026) demonstrates Lyft’s dispatch/matching/payment stack can already integrate AV supply. Answer: Yes (early-stage, single-market proof point).
Usage anchoring signals: AV trip volume is not yet separately disclosed as a percentage of Gross Bookings (almost certainly sub-1% currently). May Mobility safety-driver-assisted rides began in Atlanta in 2025; Tensor robocars targeted for 2027 fleet delivery; Baidu Apollo Go vehicles targeted for the UK/Germany 2026.
Because the AV-specific pricing tier question scores “No/Partial,” per the framework’s Sensitivity Analysis Requirement, a full Autonomous Supply Transition Success Rate (0–100%) sensitivity must be applied to Step 3.5’s scenario model rather than assuming a smooth transition (see §4.7 below). Max Contribution-Margin Improvement estimate: if driver-related cost is conservatively estimated at ~50–55% of Gross Bookings industry-wide (a reasonable proxy given typical 70%+ driver-pay-of-fare guarantees net of platform fee), and Lyft could capture roughly a third of that as incremental margin in a fully autonomous future, Max CM Improvement ≈ 17–20pp — a materially smaller figure than the framework’s illustrative 30pp example for a higher-take-rate, lower-driver-share marketplace, reflecting Lyft’s own driver-pay commitments (≥70% of “external” rider payments after fees).
4.7 AI/Autonomous-Driven Unit Economics Scenario (Marketplace Adaptation)
Applying the framework’s mapping function (CM Improvement = Transition Success Rate × Max CM Improvement, Max ≈ 18pp):
Pessimistic (20% transition success): CM improvement ≈ 3.6pp → Adjusted EBITDA margin proxy rises from ~2.9% toward ~6.5% of GB in AV-penetrated markets only, with negligible blended impact given AV’s sub-1% current GB share.
Base (50% transition success): CM improvement ≈ 9pp, again concentrated in early AV cities; blended company-wide impact remains modest through the 2026–2028 horizon, given the phased, city-by-city rollout (Nashville, Atlanta, select UK/Germany markets).
Optimistic (80% transition success): CM improvement ≈ 14.4pp in AV-penetrated markets; if AV scales to a meaningful share of GB by the early 2030s, this could be transformative, but on a 3–5 year horizon the framework’s own phased S-curve logic (a handful of cities, single-digit percent of GB) argues for treating this as a long-dated call option, not a near-term financial driver. No top-level red flag is triggered by the new unit economics under any scenario at current, very early AV penetration levels.
4.10 Cash Flow Quality & Capex Efficiency
FY2025 operating cash flow $1.17B, free cash flow $1.12B (record), against Adjusted EBITDA of $528.8M — an FCF/Adjusted-EBITDA conversion ratio above 200%, which is unusually high and should be interpreted with care. A meaningful share of this gap is structural to insurance-heavy marketplaces (float from reserves, timing of claims payments) rather than purely “clean” operating cash generation; the company’s own 90%+ FCF-conversion target (measured against Adjusted EBITDA) for 2025–2027 is itself an acknowledgment that >100% conversion in any single year is partly a timing phenomenon rather than a sustainable structural multiple. TTM free cash flow as of Q1 2026 reached $1.1B (all-time high). Capex is modest (asset-light marketplace; Flexdrive vehicle financing is largely held off-balance-sheet via leasing/rental structures).
4.11 Audit Opinion & SBC
No going-concern, material weakness, or adverse audit opinion identified. Stock-based compensation: Q1 2026 total SBC across cost-of-revenue, opex, and G&A lines was ~$86.9M against $1.65B revenue (~5.3% of revenue), down from ~6.4% in Q1 2025 — a healthy declining trend, well within the framework’s tolerance band for a company in the $1–5B revenue tier (<15% tolerable, ideally trending toward <8%).
5. Macro & Marketplace Industry Environment
5.1 AI Regulation & Algorithmic Pricing Scrutiny
A June 2026 Consumer Reports investigation found that Uber and Lyft frequently quote materially different fares for functionally identical rides requested under similar conditions, raising algorithmic-pricing-fairness questions that could attract state attorney-general or FTC attention (Lyft already has an FTC enforcement history on driver-earnings-claims transparency, settled 2024 for $2.1M). This is a live reputational and potential-regulatory risk, not yet a financial one.
5.2 Antitrust & Platform Ecosystem
No material DMA-style marketplace antitrust exposure identified for Lyft specifically (unlike a Hybrid Marketplace+1P business with self-preferencing risk). Lyft’s scale is sub-critical for most antitrust regimes globally; the more relevant competition-policy angle is pro-competition advocacy (regulators generally favor having a viable #2 to Uber, which, if anything, is a mild tailwind for Lyft’s survival thesis).
5.3 Interest Rates & Consumer Discretionary Sensitivity
Rideshare Gross Bookings correlate with consumer discretionary spending and disposable income; both Uber’s and Lyft’s 2026 commentary references “complex macro backdrop” and weather/event-driven volatility (peak events like Valentine’s Day, Super Bowl driving outsized short-term demand) without yet showing demand deceleration. Lyft’s recent debt issuance ($450M convertible notes due 2030) was priced in a rate environment that, while elevated versus the 2010s, has not impeded the company’s ability to fund both growth initiatives and an aggressive buyback program simultaneously.
5.4 TAM & Autonomous-Driving TAM Reshaping
Lyft’s own framing (TAM “nearly doubling” with FREENOW to >300B annual personal-vehicle trips) reflects a genuine expansion of addressable market through geographic diversification. The AV question cuts both ways for TAM: AVs could expand mobility TAM (24/7 availability, underserved areas) but could equally cannibalize human-driver rideshare TAM if vertically-integrated operators capture share without partnering.
5.6 EU Data Act / DMA / Platform Work Directive Clarification
Per the framework’s explicit non-applicability note for consumer marketplaces, the EU Data Act’s contractual-termination/migration-fee provisions are not materially relevant to Lyft — Lyft’s European switching costs (such as they exist) arise from habit and liquidity, not SaaS-style contractual lock-in. The more material EU exposure is the EU Platform Work Directive (member states have until December 2026 to transpose it into national law), which could push toward presumption-of-employment standards for platform workers across Lyft’s nine new European markets — a genuine, monitorable regulatory risk given Lyft’s newly expanded EU footprint via FREENOW.
5.8 Gig Economy & Worker Classification Regulation — Detailed Tracking
The US regulatory picture is currently a net tailwind at the federal level but a patchwork headwind at the state level:
Federal (tailwind): The Department of Labor’s May 2025 Field Assistance Bulletin paused enforcement of the Biden-era 2024 independent-contractor rule, reverting to a more contractor-friendly “economic realities” standard. A new proposed DOL rule (published February 27, 2026, comment period closed April 28, 2026) would formally rescind the 2024 rule and elevate “control” and “opportunity for profit or loss” as the two dominant factors — a standard expected to generally favor independent-contractor classification for rideshare drivers if finalized.
State (headwinds, idiosyncratic): New Jersey finalized ABC-test administrative regulations (effective October 1, 2026) that explicitly contemplate ride-hailing drivers failing the test and being deemed employees — directly relevant given Lyft’s prior $19.4M NJ misclassification settlement. California’s AB 1340 (effective January 1, 2026) creates a novel non-employee collective-bargaining right for high-activity TNC drivers, raising compensation-negotiation risk without triggering a full reclassification shock. The EU Platform Work Directive transposition deadline (December 2026) adds a parallel European-side risk given the new FREENOW footprint.
Probability-weighted assessment: No single >20%-of-GB jurisdiction currently has a binding, in-force reclassification law as of this report’s date — the hard-stop “Marketplace Regulatory Reclassification” elimination hurdle from Step 0 is not triggered. However, the NJ rule (effective Q4 2026) and the EU Platform Work Directive transposition (effective by Q4 2026) both represent near-dated, concrete catalysts requiring an explicit recheck in Q4 2026, and a probability-weighted Contribution-Margin discount of 5–10pp in the bear-case scenario is applied in §7.5 below.
5.10 Overall Macro/Industry Assessment: Neutral, tilting toward mild Headwind on the regulatory dimension specifically and mild Tailwind on the federal-labor dimension and consumer-spending dimension specifically (net: Neutral).
6. Moat Depth Evaluation
6.1 Intangible Assets
Lyft’s brand carries reasonable US/Canada consumer recognition (distinct pink branding, “friendlier” positioning historically) but lacks Uber’s category-defining “verb” status (”call an Uber” vs. no equivalent “Lyft” verb usage at scale). City-level TNC operating permits exist but are not exclusive or scarce in most jurisdictions Lyft operates in — a weak, not absent, regulatory-license moat.
6.2 Switching Costs & Liquidity-Based Stickiness
As the framework notes, marketplace switching costs arise from liquidity and habit, not contractual lock-in. Lyft’s switching-cost case is weak-to-moderate: (a) demand-side multi-homing is very likely above the 50% “high” threshold based on industry-standard rideshare usage patterns and Lyft’s own dual-app driver commentary (Assumed Proxy, increased uncertainty); (b) Lyft lacks a subscription program at anywhere near Uber One’s 46–50M-member, ~half-of-GB scale, removing one of the two concrete switching-cost levers the framework identifies; (c) data-driven UX advantages (faster matching, better routing) exist but are not demonstrably superior to Uber’s at Lyft’s smaller scale, and if anything Uber’s larger dataset should compound favorably over time.
6.3 Cost/Technology Advantage
No structural cost advantage versus Uber identified; if anything, Lyft’s smaller scale implies higher per-unit fixed-cost burden (engineering, trust & safety, corporate overhead) spread across a smaller Gross Bookings base, consistent with its persistently lower Adjusted EBITDA margin.
6.4 Network Effects
Local liquidity network effects genuinely exist (more drivers → shorter wait times → more riders, and vice versa) but are diluted by high multi-homing, per the framework’s explicit guidance that multi-homing weakens network-effect exclusivity. Data network effects (demand prediction, dynamic pricing) are present but not demonstrably differentiated from Uber’s.
6.6 Marketplace Liquidity Flywheel — Quantified Scorecard
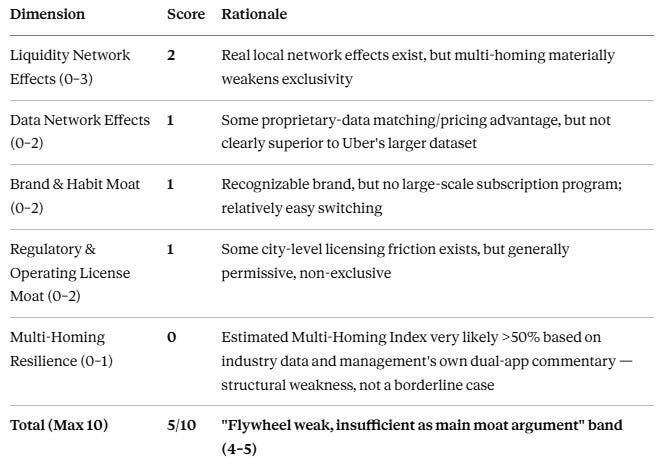
Moat Width Rating: Narrow. Two or more moat-erosion leading indicators are present (multi-homing rate elevated; relative competitive disadvantage on margin/subscription/AV breadth versus Uber), warranting an explicit “Monitoring” tag alongside the Narrow rating. This is not a “wide moat compounder” thesis; it is a turnaround/relative-value thesis with optionality on AV partnerships and European diversification.
Valuation mapping consequence (per Step 5.1 rule): Because the Moat Rating is Narrow, positive (premium) valuation adjustments from the flywheel score do not apply regardless of score; negative adjustments execute fully. A flywheel score of 5 (4–5 band) would, under a Wide or Medium moat, imply a 5–10% discount to peer multiples — under a Narrow moat this discount is applied in full, not halved (see §7.6).
7. Valuation Analysis
7.1 Current Market Multiple Anchor
Lyft: Market cap ≈ $5.6B; estimated EV ≈ $5.4–5.6B (modest net cash position as of Q1 2026: cash $1.13B against an estimated ~$0.9–1.0B total debt, primarily the $450M Convertible Senior Notes due 2030 issued in late 2025). TTM Revenue ≈ $6.5B; TTM Gross Bookings ≈ $19.3B. Uber (peer anchor): Market cap ≈ $144–147B; EV ≈ $153–157B; TTM Revenue ≈ $53.7B; EV/Revenue ≈ 2.8x; EV/EBITDA ≈ 15.6–22.5x (range across data providers/dates); P/E ≈ 15.6–17.7x.
7.2 Lifecycle Positioning & Metric Selection
Per the marketplace valuation framework, EV/Revenue, EV/Gross Bookings, and FCF Yield are the primary lenses at Lyft’s lifecycle stage (boundary of Scale-Up/Mature).
7.3–7.4 Current Valuation, Historical Percentile, and Peer Comparison
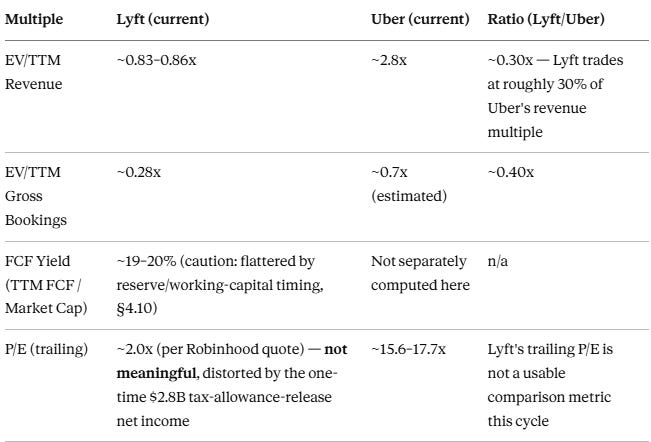
Reverse-DCF / Implied Growth Check: A sub-1x EV/Revenue multiple against mid-teens Gross Bookings growth and a still-thin (but expanding) margin profile implies the market is pricing in either (a) continued multi-year margin/growth convergence risk versus Uber, (b) meaningful execution/regulatory/AV-bypass risk, or (c) some combination — consistent with the wide analyst price-target dispersion ($13–30) and Hold/Neutral consensus rather than a clear directional view.
7.5 Scenario Analysis (Bull / Base / Bear)
Base Case: Anchored to management’s reaffirmed 2027 targets (Gross Bookings CAGR ~15% 2024–2027, Adjusted EBITDA margin ~4% of GB by 2027, FCF conversion >90% of Adjusted EBITDA). This implies FY2027 Gross Bookings ≈ $20.7B and Adjusted EBITDA ≈ $828M. Applying the Narrow-moat-adjusted EV/Gross-Bookings multiple (peer EV/GB ~0.7x for Uber, discounted per §6.6’s flywheel-driven 5–10% haircut and a further structural discount for Lyft’s sub-scale/margin gap, landing in a ~0.30–0.40x range) yields an implied EV of roughly $6.2–8.3B by 2027 — modest appreciation from today’s ~$5.5B, before discounting back to present value.
Bear Case: Overlays (i) the §5.8 regulatory risk (5–10pp probability-weighted Contribution Margin compression from NJ/EU Platform Work Directive developments) at 50% weight against (ii) a macro/consumer-discretionary slowdown reducing Gross Bookings growth toward high-single-digits, and (iii) continued AV-partnership-breadth disadvantage versus Uber preventing margin convergence. Combined effect: Adjusted EBITDA margin stalls near 2.5–3% of GB rather than reaching 4%, and the EV/GB multiple compresses further toward 0.2x on perceived structural-disadvantage concerns — implying material downside from current levels.
Bull Case: FREENOW/Gett integration proves accretive faster than guided, the Nashville/Atlanta AV pilots scale successfully and Lyft secures additional AV partnerships (closing the breadth gap with Uber), the federal DOL rule finalizes in contractor-friendly form removing near-term reclassification overhang, and Lyft Media/advertising scales meaningfully (even reaching a fraction of Uber’s >$2B annualized run-rate would be transformative given Lyft’s much smaller revenue base) — supporting margin convergence toward Uber’s level and a re-rating toward 0.5–0.6x EV/GB, consistent with the high end of the analyst price-target range (~$30, ~110% upside from current levels).
Marketplace Autonomous Supply Sensitivity Transmission (per §4.7 mapping): Given AV’s currently negligible share of Gross Bookings, the autonomous-supply scenario does not materially move the 2026–2028 base case; it is appropriately treated as embedded optionality rather than a near-term cash-flow driver, consistent with the framework’s non-linear, city-by-city S-curve guidance.
7.6 Moat Flywheel Adjustment Summary
Flywheel score 5/10 (4–5 band) × Moat magnitude coefficient for Narrow (0% premium/discount executes in full) = 5–10% discount applied to the peer-derived base multiple, already incorporated into the Base Case multiple range above.
7.9–7.10 FCF Yield, Insider/Institutional Dynamics
FCF yield is nominally attractive (~19–20%) but should be discounted for the reserve-timing caveat in §4.10. Insider dynamics: the August 2025 founder Board exit and Class B-to-Class A conversion removed a long-standing governance overhang (dual-class control) and is a modest positive signal for institutional-ownership-friendliness, though it also means founder “skin in the game” via super-voting control no longer exists as an alignment mechanism. Activist investor Engine Capital’s involvement in pushing for the 2025 buyback program expansion (from $500M to $750M) indicates active shareholder engagement on capital allocation.
7.11–7.12 Entry Timing & Price Opinion
Price Opinion: Fairly Valued to Modestly Undervalued, with high dispersion of reasonable outcomes given the genuine, unresolved competitive and regulatory uncertainty. The stock’s low absolute revenue/GB multiples relative to Uber are partly justified by real fundamental gaps (margin, subscription penetration, AV breadth) and are not simply a “free lunch” mispricing — but the magnitude of the discount (Lyft trading at ~30% of Uber’s revenue multiple while Lyft’s own fundamentals, though weaker, are not 70% worse) leaves room for a reasonable bull case built on incremental execution rather than a moat transformation. This is consistent with the framework’s required disclosure that this analysis is for informational purposes only and does not constitute a buy/sell recommendation; the person should treat the $13–30 analyst-target range as itself diagnostic of the genuine uncertainty here rather than seeking false precision from this report.
8. Management & Capital Allocation
8.1 Leadership: CEO David Risher (joined April 2023 as an outside operational turnaround hire, not a founder) and CFO Erin Brewer have executed a credible multi-year “comeback” — sixteen-plus consecutive quarters of double-digit Gross Bookings growth, the company’s first full year of GAAP profitability (FY2024), and a now-mature capital-return program. Neither has the multi-decade platform-scaling pedigree of Uber’s Dara Khosrowshahi, but the operational-discipline track record over three years is solid and consistent.
8.2 Guidance Accuracy: Lyft has met or exceeded quarterly Gross Bookings and Adjusted EBITDA guidance consistently through the period reviewed (Q1–Q4 2025, Q1 2026), with Q2 2026 guidance calling for accelerating Gross Bookings growth (~18–21%) and Adjusted EBITDA growth (>30%) — a pattern of consistent, credible guidance delivery rather than either chronic misses or suspicious “always-just-barely-beats” engineering. No CFO departure, KPI-definition inconsistency, or major accounting-estimate-change red flags were identified in this research window, aside from the recurring large reserve-adjustment pattern flagged in §4.8, which warrants ongoing scrutiny rather than an immediate red-flag escalation.
8.4 Capital Allocation: Lyft has moved from a single-purpose cash-preservation posture to active, multi-pronged capital deployment: the FREENOW acquisition (~$197M, April 2025, closed mid-2025) and Gett UK business acquisition (closed Q1 2026) represent disciplined, modestly-sized adjacency M&A (not unsustainable >5-deals-per-year pace) rather than large, integration-risky bets; the AV strategy is explicitly partnership-based (capital-light) rather than a costly proprietary-fleet build, consistent with prudent capital discipline for a company of Lyft’s scale; and the buyback program has scaled from an inaugural $500M (February 2025) to $750M (mid-2025) to an additional $1B (February 2026) to a further additional $1B (May 2026), with $300M repurchased in Q1 2026 alone (the largest single quarter to date) — an aggressive but cash-flow-supported capital-return posture, partly driven by constructive activist engagement (Engine Capital).
8.6 Regulatory Navigation Score: 2/3. Management has navigated regulatory challenges (NJ misclassification settlement, FTC earnings-claims settlement) competently with quantified, resolved financial impact and no permanent business-model damage, but the approach has been largely reactive (settling after enforcement action) rather than proactively shaping favorable outcomes — placing Lyft at the “competent but reactive” tier rather than the top tier.
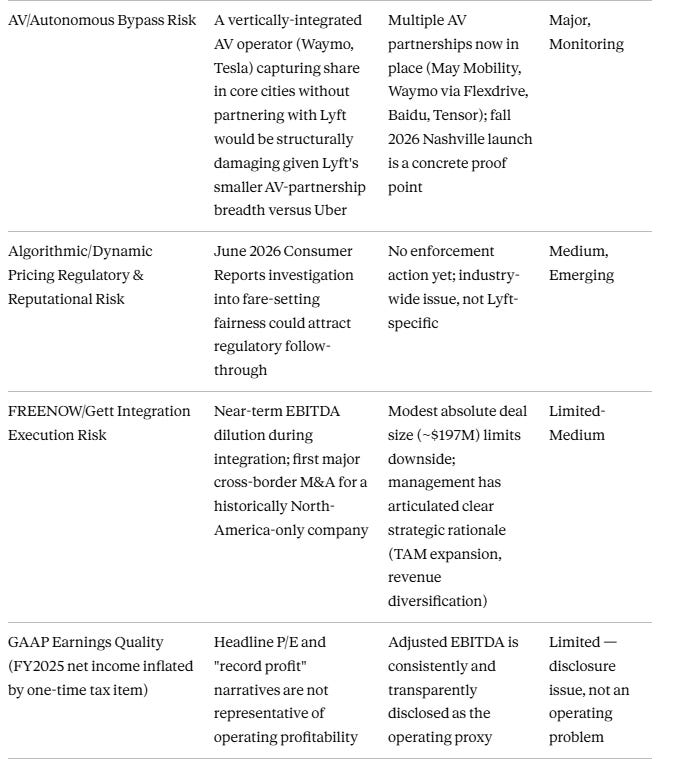
9. Risks & Red Flags
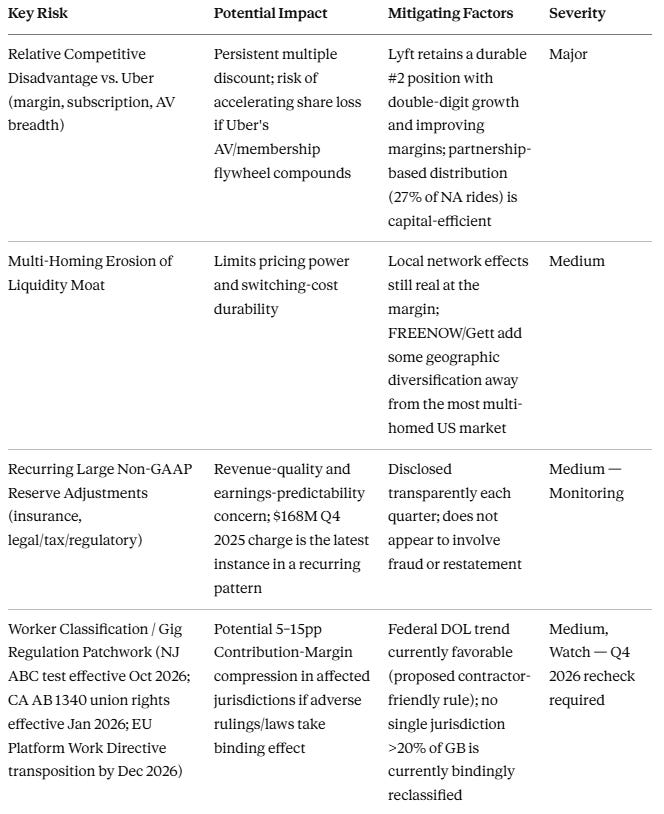
Moat Erosion Leading Indicators Triggered: Multi-Homing Erosion (estimated Index >50%) and Relative Competitive Disadvantage are both present — per the framework’s rule, 2+ triggered indicators require the moat rating to carry an explicit “Monitoring” tag, which is reflected in §6.6’s Narrow + Monitoring rating.
9.6 Extreme Scenario Stress Test
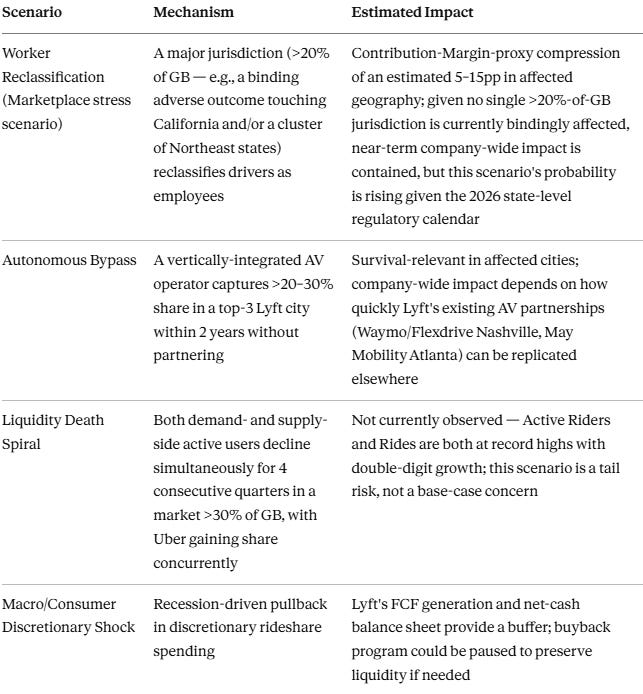
Stress Test Survivability Conclusion: Moderate. Lyft is not fragile (positive FCF, net cash, credible management, multiple AV partnerships providing optionality rather than a single-point-of-failure bet), but it lacks the absolute margin and scale buffer of Uber, meaning a compounding multi-shock scenario (regulatory + AV bypass + macro) would erode the investment thesis meaningfully faster than for the category leader.
10. Overall Assessment
Moat Width Rating: Narrow (Monitoring tag — multi-homing erosion and relative competitive disadvantage both triggered).
Business Model Classification Filtering Conclusion: Lyft passes the Step 0 elimination hurdles (no going-concern opinion, no fraud/restatement, no malicious insider selling, no binding marketplace regulatory reclassification currently in force, no hardware-safety grounding analogue applicable). It is a legitimate, analyzable Take-Rate Marketplace, not a candidate for outright elimination.
Long-Term Outperformance Probability: Moderate-to-low conviction for outperformance versus the broader market, and genuinely uncertain versus Uber specifically — the bull case requires Lyft to close gaps (subscription, AV breadth, margin) that have persisted for years, while the bear case requires only that those gaps persist or widen, which is the lower-effort outcome for the incumbent leader to achieve.
Key Risk Factors: Relative competitive disadvantage to Uber; multi-homing-diluted network effects; recurring large reserve/non-GAAP adjustments; worker-classification regulatory patchwork (Q4 2026 recheck required); AV-bypass risk; algorithmic-pricing reputational/regulatory exposure.
Exit Criteria (Quick Reference): Marketplace dual-retention override (demand <70% AND supply <60% retention, 3 consecutive quarters) — not currently triggered, no granular retention data disclosed to test directly (data gap, increases uncertainty). Take-rate-compression-plus-negative-margin override — not triggered (margin is positive and expanding). Regulatory model break (>20% GB jurisdiction reclassification with failed 12-month mitigation) — not triggered, but NJ/EU developments require explicit Q4 2026 review. Autonomous bypass override (>20% share loss to AV competitor in a core city, no Lyft response within 24 months) — not triggered; monitor Nashville/Atlanta AV launches as the live test case.
Position Recommendation: Suitable only as a speculative-to-small, non-core position (consistent with a Narrow-moat, “Fragile-to-Moderate” stress-test profile) for investors specifically seeking torque on the North American rideshare #2 / AV-optionality / European-diversification thesis at a discounted multiple to Uber, not as a core long-term compounder holding. Position cap should sit at the lower end of the Narrow-moat tier (≤5% of portfolio, and arguably toward 2–3% given the Moderate-not-Resilient stress-test rating and the unproven nature of the AV and European-expansion catalysts).
Investment Opinion (for reference only — not investment advice): Fairly-valued-to-modestly-undervalued on a relative-multiple basis versus Uber, with the valuation gap substantially, though perhaps not entirely, justified by real fundamental differences; the thesis is better suited to investors with a multi-year horizon and tolerance for binary AV/regulatory catalysts than to investors seeking a clean, low-uncertainty compounding story.
11. Analysis Uncertainty Level
Data Completeness: Medium-High uncertainty. Several material data gaps were identified and disclosed throughout this report rather than papered over: (a) Lyft no longer discloses true Contribution Margin (proxy: Adjusted EBITDA margin, which is conservative/understates true unit economics); (b) no independently-sourced Multi-Homing Index specific to Lyft exists (industry-proxy estimate used); (c) demand-/supply-side retention rates are not separately disclosed (Active Rider and Rides growth used as imperfect proxies); (d) precise current total-debt figure for Q1 2026 was estimated rather than directly extracted; (e) Lyft Media/advertising revenue scale is not separately quantified at a level comparable to Uber’s disclosed >$2B figure. Per the pre-launch checklist, these gaps increase the overall uncertainty rating by approximately one full notch from what a fully-disclosed comparable company would warrant.
Reasoning Quality Self-Assessment:
Falsification completeness: The bull case (AV breadth closing, European accretion, margin convergence) and bear case (regulatory patchwork, AV bypass, multi-homing erosion) were both constructed and weighed rather than defaulting to a single narrative.
Causal chain completeness: The take-rate-versus-Uber discrepancy was specifically investigated and resolved as a revenue-recognition artifact rather than left as an unexplained, potentially misleading headline number — an important integrity check that materially affects how this report’s metrics should be read.
Base-rate correction: Position sizing and moat rating were deliberately capped (Narrow, not Medium) despite Lyft’s genuinely improving fundamentals, in recognition of the base-rate reality that distant #2 marketplace competitors rarely close structural gaps to a well-capitalized, faster-growing, higher-margin incumbent.
Assumption transparency: Multi-homing index, max-CM-improvement-from-AV, and EV/GB peer multiples were all explicitly flagged as estimates with stated methodology rather than presented as precise figures.
Linkage to Position Rules: Given the Medium-High data-completeness uncertainty and the Moderate (not Resilient) stress-test rating, position sizing should sit at or below the lower bound of the Narrow-moat cap (≤5%, arguably 2–3%) per the framework’s portfolio-integration guidance.
12. Post-Analysis Review Points
6-Month Recheck (December 2026): (1) Has the FREENOW/Gett integration reached the previously-guided EBITDA-breakeven/accretion timeline, or is dilution persisting beyond plan? (2) Has New Jersey’s ABC-test rule (effective October 2026) resulted in any concrete enforcement action or settlement affecting Lyft’s NJ driver classification? (3) Has the federal DOL independent-contractor rule been finalized, and in what form? (4) What is the Nashville Flexdrive/Waymo AV launch’s early trip volume and unit-economics data, if disclosed? (5) Has Lyft Media/advertising revenue been separately quantified at a scale enabling a cleaner comparison to Uber’s advertising business?
12-Month Recheck (June 2027): (1) Has Adjusted EBITDA margin (% of GB) progressed meaningfully toward the 2027 target of ~4%, or stalled below 3.5%? (2) Has the Multi-Homing Index gap versus Uber narrowed (via subscription-program launch or other stickiness initiatives) or widened? (3) Has the EU Platform Work Directive’s December 2026 transposition deadline produced binding national legislation affecting Lyft’s nine European FREENOW markets, and with what quantified Contribution-Margin impact? (4) Has AV partnership breadth (number of live cities, partners) closed any of the gap versus Uber’s 25+-partner, 7-city-live position? (5) Has the recurring pattern of large non-GAAP reserve adjustments continued, stabilized, or worsened?
Marketplace Regulatory Compliance Annual Checklist: Worker-classification tracker (NJ, CA AB 1340, EU Platform Work Directive) — all three require active 2026 monitoring as detailed in §5.8. City operating license status — no near-term renewal risk identified in this research window. Autonomous supply partnership progress — Nashville (fall 2026) and Atlanta (live) are the two concrete near-term data points to track. Multi-homing data — no fresh third-party panel data point was independently sourced in this research cycle; recommend explicit Sensor Tower/Bloomberg Second Measure data acquisition for the next full review cycle.
Limitation Statement — Honest Conclusion
If this analysis proves wrong in the future, the most likely reason is a fundamental blind spot in how durable the rideshare duopoly’s local liquidity advantage actually is against AV disintermediation — this report treated AV as a multi-year optionality/S-curve question for both Lyft and Uber, following the framework’s own guidance, but it is equally plausible that AV adoption inflects faster and more discontinuously than any phased-rollout model assumes, in which case the entire “Lyft vs. Uber relative-value” framing used throughout this report becomes secondary to a more basic “which marketplace, if any, survives AV-native vertically-integrated competitors” question that neither company’s current disclosures allow a confident answer to. A secondary, more mundane risk is data error: several key inputs (Multi-Homing Index, true Contribution Margin, precise debt figures, Lyft Media’s revenue scale) were estimated or proxied rather than directly extracted from primary filings, and a future analyst with cleaner access to these figures could reasonably reach a different moat or valuation conclusion than this report did.
Analyzed Case Tracking Template

Disclaimer: This analysis is for educational and informational purposes only and does not constitute investment advice. All investment decisions should be based on your own due diligence and, where appropriate, consultation with a qualified financial advisor. Past performance does not guarantee future results. Data sourced from Lyft, Inc. and Uber Technologies, Inc. SEC filings (10-K, 10-Q, 8-K press releases) via SEC EDGAR, company investor-relations releases, and financial/news media current as of June 21, 2026; several marketplace-specific metrics (Multi-Homing Index, true Contribution Margin, Lyft Media revenue scale) were estimated or proxied due to incomplete public disclosure and are explicitly flagged as such throughout this report.