
Microsoft Business Deep Dive: The Cleanest AI Monetization Structure in Enterprise Tech — Here's the Exact Mechanism
For Microsoft, every additional AI query is incremental revenue on a locked seat. For Google, every AI-answered query is a displaced paid click. That asymmetry compounds over time.

Microsoft has evolved from a pure “software company” into a diversified commercial powerhouse. The essence of its business model: Microsoft is a platform company building enterprise-grade ecosystems, locking in corporate and individual users through an integrated platform spanning cloud services, productivity tools, and AI solutions — and in doing so, continuously generating high-margin recurring revenue.
Microsoft’s business model has undergone three fundamental transformations.
The first was the shift from one-time software licensing to subscription, creating a predictable recurring revenue base.
The second was the transition from pure software to cloud computing services (IaaS/SaaS/PaaS), unlocking a usage-based revenue structure.
The third — currently underway — is a full-scale pivot to “AI Infrastructure as a Service”: selling not just compute, but model training and inference capabilities, AI agent development tools, and AI-enhanced productivity software, positioning itself as the underlying infrastructure layer for all enterprise AI workloads.
In FY2025 (Microsoft’s fiscal year ends June 30), full-year revenue was $281.7B, operating income $128.5B, and net income $101.8B. In FY26 Q3 (January–March 2026), revenue reached $82.9B, up 18% YoY; net income $31.8B, up 23% YoY; EPS $4.27. These numbers must be read alongside the business logic below — they represent three fundamentally different profit models operating in parallel within a single company.
Profit Structure Deep Dive: Three Business Segments
The Three Engines at a Glance
The table below provides a complete view of all three engines using FY26 Q3 data:
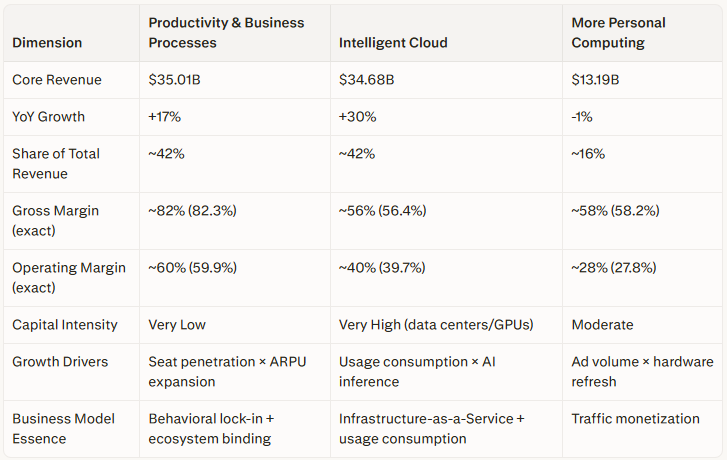
This differentiated profit structure is the key to understanding Microsoft’s business model.
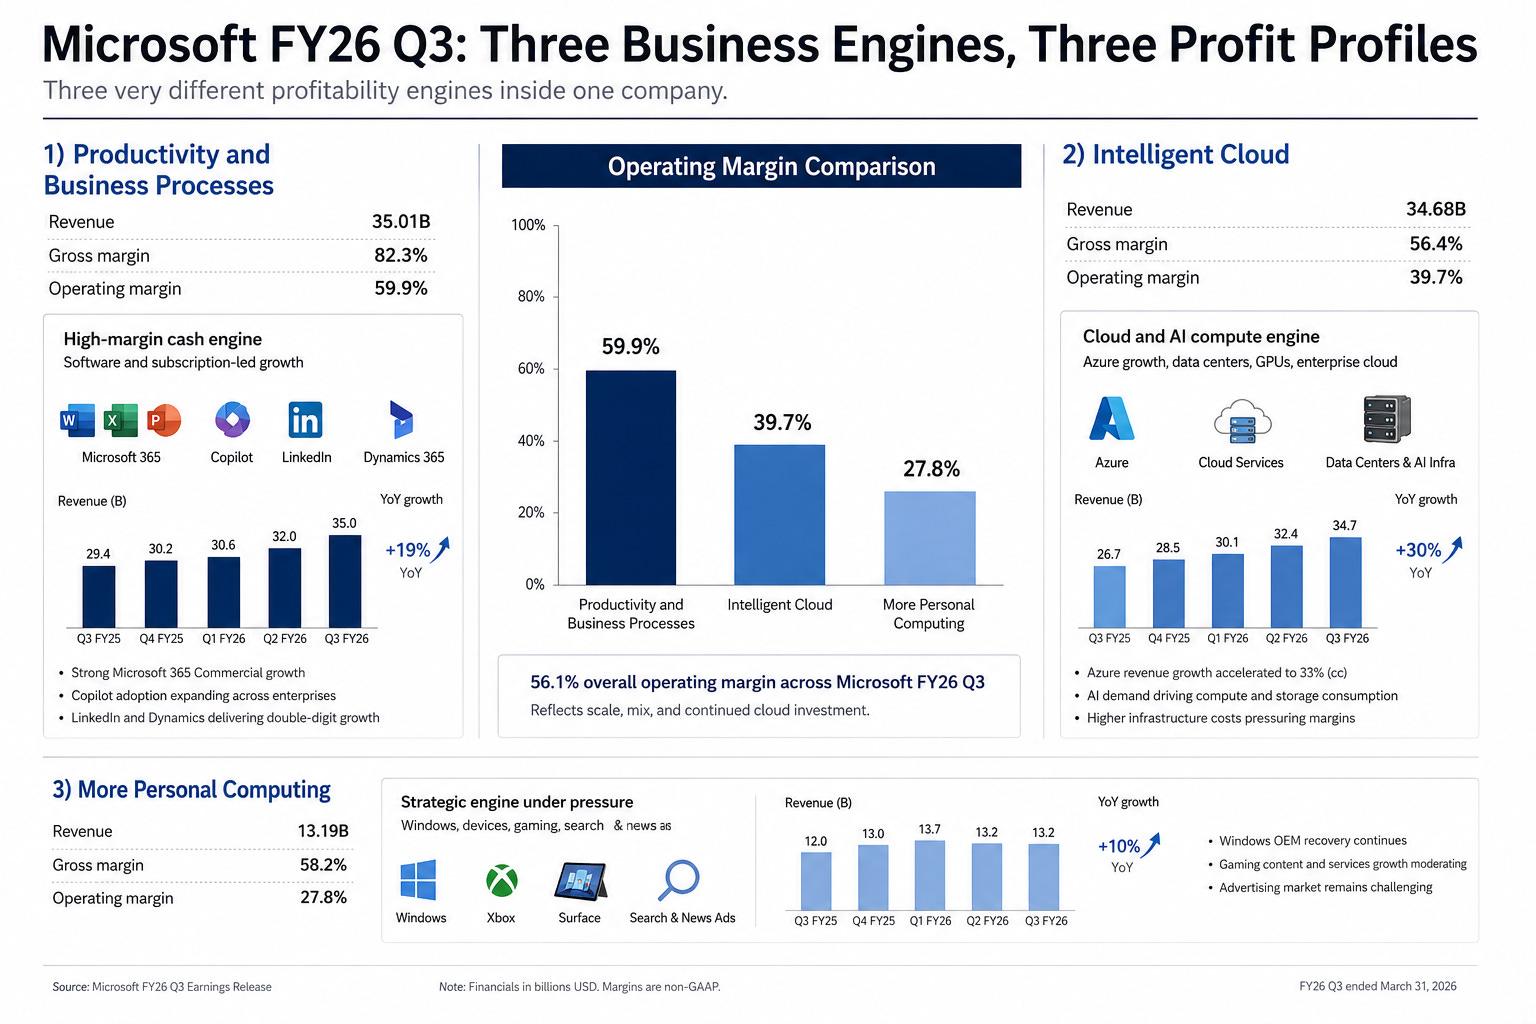
Productivity & Business Processes delivers the highest margins (gross margin 82.3%, operating margin 59.9%) but at a lower growth rate.
Intelligent Cloud carries a ~56% gross margin constrained by rapidly expanding infrastructure costs, and a ~40% operating margin.
More Personal Computing has a ~58% gross margin but only a 27.8% operating margin — the lowest of the three — reflecting how high fixed costs (R&D, channels, hardware) suppress profitability even when revenue holds up.
The complete operating margin comparison across the three segments (59.9% / 39.7% / 27.8%) clearly exposes three fundamentally different quality-of-earnings profiles operating within a single company.
Productivity & Business Processes: High-Margin Cash Engine — From “Selling Seats” to “Selling Efficiency”
This segment covers Microsoft 365 Commercial and Consumer Cloud, LinkedIn, and Dynamics 365. FY26 Q3 revenue of $35.01B, up 17% YoY, makes it Microsoft's largest and most stable profit source.
① Microsoft 365 Commercial Cloud: From “Seat Subscription” to “Seat + AI Agent.”
Commercial Cloud revenue grew 19%, driven primarily by per-user revenue (ARPU) expansion, with Microsoft 365 E5 high-value modules and Copilot penetration as the core catalysts. Management-disclosed enterprise renewal rates remain at 98%, forming Microsoft’s most stable cash flow foundation.
As of FY26 Q3, Copilot paid seats reached 20 million (per management disclosure). Using the enterprise Copilot add-on pricing (~$30/user/month for E3/E5) as a ceiling, this single product could generate annualized revenue approaching $7.2B — though actual blended ASP is lower due to bundle discounts and tiered pricing (this is a rough ceiling estimate based on public pricing, not a precise revenue figure). The seat count was 15 million in January 2026, a net addition of 5 million in a single quarter (per management disclosure). Customers with more than 50,000 Copilot seats quadrupled YoY (per management disclosure); Accenture has exceeded 740,000 seats, and Bayer, Johnson & Johnson, Roche, and Mercedes-Benz have each committed to deployments exceeding 90,000 seats (per management disclosure).
Management cited “per-user query volume growing nearly 20% QoQ” and “weekly active usage reaching internal targets” — but disclosed no specific active user share or absolute figures, making independent verification of actual usage depth difficult. These statements carry limited analytical value beyond serving as qualitative management signals.
② Microsoft 365 Consumer Cloud: Direct ARPU Lift
Consumer Cloud revenue grew 33%, significantly outpacing Commercial Cloud. The primary driver was the January 2025 price increase: Personal plan annual fee rose from ~$70 to $99.99, Family plan rose to $129.99 — a YoY increase of over 40%. Ongoing AI feature additions have deepened user dependence on the M365 ecosystem, providing the foundation for price increases.
③ LinkedIn: Monetizing the Data Flywheel
LinkedIn revenue grew 12%, driven by Premium subscriptions, Talent Solutions, and Marketing Solutions. Microsoft could theoretically combine LinkedIn's professional graph with GitHub developer behavioral data to deliver precision hiring, training, and talent intelligence — but this synergy currently manifests more as a strategic narrative than a measurable revenue contribution, as Microsoft has not separately disclosed any revenue attributable to data integration in its filings.
④ Dynamics 365: AI-izing Core Business Processes
Dynamics 365 grew 22%, the fastest-growing component within the segment, serving as Microsoft’s strategic vehicle for embedding AI into enterprise CRM, ERP, and supply chain management.
Takeaway: The Productivity segment’s essence is using Office/M365 as a foundation to upgrade “users” into “AI-augmented enterprise employees” through Copilot and Dynamics. With an 82.3% gross margin and 59.9% operating margin, it provides the financial backstop for all of Microsoft’s expansionary investments.
Intelligent Cloud: The Growth Engine — From “Selling Servers” to “Selling AI Compute as a Service”
This segment covers Azure, server products (SQL Server, Windows Server), and Enterprise Services. FY26 Q3 revenue of $34.68B, up 30% YoY, is nearly on par with Productivity in dollar terms but growing at nearly twice the rate. Multiple broker research estimates (third-party estimates, since Microsoft does not separately disclose precise Azure revenue) place FY2025 full-year Azure revenue above $75B for the first time.
① Azure and Other Cloud Services: The Demand-Exceeds-Supply Core Engine
Azure and Other Cloud Services grew 40% YoY (39% in constant currency), accelerating from the prior quarter’s 39%. Management was explicit: demand continues to outstrip available capacity across workloads, customer segments, and geographies.
Azure is fundamentally an “AI compute meter” — enterprises pay per actual usage for model training, inference, and data storage.
Persistent penetration of AI training workloads: More enterprises migrating AI model training from on-premises data centers to Azure
Scaling of AI inference workloads: As more AI applications go live, inference demand grows at an even faster rate
Continued migration of traditional cloud workloads: The migration wave is still ongoing
In FY26 Q3, management disclosed that “Azure AI contributed approximately 12 percentage points to Azure’s overall growth rate” — to be precise, this means AI contributed 12 of Azure’s total 40 growth percentage points, representing approximately 30% of overall growth. Separately, Microsoft disclosed “AI business annualized revenue exceeding $37B, up 123% YoY” — this broader “AI business” metric encompasses Azure AI, M365 Copilot, GitHub Copilot, and other AI-related revenue, and is not the same statistical scope as the 12-percentage-point Azure contribution figure. The two should not be directly cross-referenced in calculations.
FY26 Q4 Azure guidance is 39–40% growth. Management acknowledged that severe capacity bottlenecks will persist at least through the end of FY2026, with meaningful growth acceleration not expected until the second half of calendar year 2026.
② Microsoft Cloud Overall: A $54.5B Cloud Giant
Microsoft Cloud total revenue reached $54.5B, up 29% YoY, approximately 66% of total quarterly revenue. It is important to clarify that Microsoft Cloud is a cross-segment revenue aggregation metric, primarily including Azure, Microsoft 365 Commercial Cloud, Dynamics 365, and LinkedIn's commercial portion — it does not include Windows, Xbox, or other MPC segment businesses, nor does it fully include consumer subscriptions. The gap between this figure and the three-segment total (~$82.9B) is primarily attributable to consumer businesses, devices, gaming, and other non-cloud revenues. These are two different measurement scopes and should not be conflated.
③ The Deeper Profit Structure Divide
Intelligent Cloud’s FY26 Q3 gross margin was 56.4% (revenue $34.68B, cost of revenue $15.12B). Costs grew approximately 47% YoY, driven primarily by Azure infrastructure expansion (data centers, GPUs, power).
Operating margin of 39.7% sits approximately 20 percentage points below Productivity’s 59.9% — a gap far wider than the gross margin differential because Intelligent Cloud also carries substantial R&D and sales operating expenses. This means that while Intelligent Cloud’s growth is explosive, its earnings quality is materially lower than the SaaS seat-subscription model. This is a structural characteristic that must be acknowledged when evaluating the economics of Microsoft’s AI investment returns.
④ Competitive Landscape: Global #2, But With Clear Differentiation
Per Gartner data, the 2024 global IaaS public cloud market reached $171.8B, up 22.5% YoY. 2024 Q3 market share (IaaS+PaaS): AWS approximately 31%, Azure 20%, Google Cloud 12%. To state it directly: Azure trails AWS by approximately 11 percentage points of share, and this gap has not materially narrowed over the past two years. More critically, OpenAI’s April 2026 agreement revision terminated Azure’s exclusive deployment rights for OpenAI models — meaning Azure transitioned from “the only hyperscale cloud that can run GPT-series models” to “one of several commodity compute platforms that can deploy OpenAI models.” The loss of model-layer differentiation is a structural competitive blow, forcing Microsoft to accelerate its own model development and multi-model strategy to compensate.
Worth noting: Microsoft’s total cloud revenue includes a massive SaaS layer (M365, Dynamics 365, etc.) that AWS does not possess, preserving a meaningful total revenue advantage even as the IaaS+PaaS share gap persists.
Takeaway: Intelligent Cloud’s essence is Microsoft positioning itself as the “compute utility of the AI era” — regardless of which model enterprises ultimately choose or which application they build, as long as compute and storage run on Azure, Microsoft collects the meter fee. But the infrastructure cost structure constrains gross margin to ~56%, far below software subscription economics — the key constraint for understanding the financial mechanics of Microsoft’s AI transition.
More Personal Computing: Under Pressure but Retaining Strategic Value
The More Personal Computing (MPC) segment covers Windows, Xbox, Surface devices, and Search & News Advertising (Bing). FY26 Q3 revenue was $13.19B, down 1% YoY. Gross margin was 58.2%, but operating margin was only 27.8% — the lowest of the three segments — reflecting how high fixed costs (R&D, channels, hardware) significantly suppress profitability.
① Windows OEM and Devices: A Passive Follower of the Hardware Cycle
This segment covers Windows, Xbox, Surface devices, and Search & News Advertising (Bing).
② Xbox Content & Services: The Transition from “Selling Consoles” to “Selling Services.”
Xbox Content & Services revenue declined 5%, mainly due to reduced hardware sales. Microsoft is attempting to reshape the gaming business model through: a 20%+ price cut to Game Pass in 2026 to attract new subscribers; simultaneously using a standalone sales strategy for flagship titles (e.g., new Call of Duty releases) to protect per-unit revenue even as hardware sales decline.
③ Search & News Advertising: AI-Driven Differentiated Growth
Search & News Advertising revenue (ex-TAC) grew 12%, with Bing’s integration of Copilot and AI capabilities generating meaningfully stronger user stickiness and advertising value.
Takeaway: Despite near-term earnings pressure and a 27.8% operating margin that underscores its low profitability efficiency, MPC retains strategic value as Microsoft’s primary “gateway” to end users — Windows and Bing build brand awareness and user habits, Xbox cultivates the developer ecosystem, and together they provide indirect strategic support for cloud and AI businesses.
Two Growth Flywheels and the Developer Ecosystem: How They Reinforce Each Other
Microsoft's business model is not the simple sum of three independent businesses — it operates through two tightly interconnected growth flywheels and one distinct developer ecosystem flywheel, all running in concert within a unified system
