
Palantir Technologies (PLTR) — Deep Analysis Report
NRR of 150%, $8B in cash, a 145 Rule of 40 — and a valuation that still prices in perfection.

As of May 11, 2026 | Sources: SEC filings (10-K, 10-Q, 8-K), Palantir Q1 2026 Business Update, Macrotrends, StockAnalysis, company IR
1. Company Snapshot
Palantir Technologies is a data analytics and AI software platform company that builds decision-intelligence infrastructure for governments and large enterprises. It is headquartered in Denver, Colorado, and trades on Nasdaq under the ticker PLTR.
Sector / Industry: Technology / Application Software
Software Category Classification: Hybrid Platform — Palantir sits at the intersection of a Platform (Foundry, Gotham, AIP operate as data infrastructure layers with deep workflow embeds) and an Enterprise Automation company (AIP Bootcamps drive rapid workflow adoption). It is not a pure SaaS subscription application. The relevant peer frame is mission-critical enterprise platforms with a government revenue mix, not horizontal SaaS.
Market Cap (May 11, 2026): ~$330 billion, with the stock trading at approximately $137.

2. Business Model Analysis
2.1 Products & Services
Palantir operates three core platforms. Gotham is the original government and intelligence platform — it handles data fusion, targeting, and mission planning for defense and intelligence agencies. Foundry is the commercial equivalent, providing data integration and operational decision-making infrastructure for large enterprises. AIP (Artificial Intelligence Platform), launched in 2023, is the AI layer that sits atop Gotham and Foundry, enabling clients to deploy large language models and AI agents directly on their proprietary operational data.
The AIP Bootcamp model — short, intensive workshops that rapidly demonstrate AI use cases to potential enterprise clients — has become the primary commercial customer acquisition engine. It is the mechanism behind the acceleration in U.S. commercial metrics.
2.2 Revenue Model
Palantir’s revenue model is hybrid: subscription + custom build + outcome-adjacent engagement. Long-term government contracts are typically structured as multi-year committed arrangements (Firm Fixed Price or time-and-materials). Commercial contracts are increasingly subscription-based with value-expansion potential. The pricing model is not primarily per-seat — it is closer to a platform access and workflow embed model, which means it is structurally more resilient to AI per-seat compression than pure-seat enterprise software. However, commercial contract values are tied partly to user adoption, which creates some seat-sensitivity at the margin.
Strategic Commercial Contracts (SCCs) are a distinct and important line item — these are non-recurring engagements involving equity stakes in early-stage companies. Palantir explicitly segments them from core ARR. When Palantir refers to “ex-SCC” growth, investors should treat that as the organic rate. Note: the SCC equity portfolio introduces mark-to-market volatility into the GAAP balance sheet, though its impact on Q1 2026 earnings has been separately diagnosed (see Section 3.5).
2.3 Target Customers
Government customers include U.S. defense agencies (DoD, Army, Special Operations Forces), allied nation intelligence services, and civil government agencies. Commercial customers are large enterprises across healthcare, manufacturing, energy, financial services, and logistics.
As of Q1 2026 (as of Q1 2026 press release):
U.S. commercial revenue: $595M, up 133% YoY and 18% QoQ
U.S. government revenue: $687M, up 84% YoY and 21% QoQ
Total U.S. revenue: $1.282B, representing 78.5% of total revenue
The customer profile skews to organizations with complex, heterogeneous operational data environments — those that cannot simply adopt off-the-shelf BI tools.
2.4 Upstream & Downstream Power Dynamics
Upstream, Palantir’s primary inputs are compute (cloud infrastructure from AWS, Azure, GCP) and talent (data engineers, ontology architects). It has no proprietary hardware dependency. The business is predominantly labor and IP-driven, which gives it structural scalability. Palantir has no meaningful bargaining disadvantage versus cloud providers at its current scale.
Downstream, Palantir holds significant pricing power within established accounts — switching costs are high (see Section 6.2), and government contracts carry multi-year lock-in. Accounts receivable have historically been elevated, reflecting a customer mix of government agencies and large enterprises that pay on government-cycle timelines. This is a structural characteristic, not a distress signal, but it constrains working capital efficiency.
3. Financial Statement Analysis
3.1 Profitability
Sources: Macrotrends (revenue, growth); SEC 8-Ks (net income); Macrotrends SBC data
Q1 2026 (confirmed, as of Q1 2026 Business Update): Revenue $1.633B (+85% YoY, +16% QoQ). GAAP net income $870.5M, 53% GAAP net margin. GAAP operating income $754M, 46% operating margin. Gross margin 84%. Adjusted gross margin 88%. Rule of 40 score: confirmed 145%.
✅ Confirmed facts: Revenue growth has accelerated in each year since 2023, from 17% → 29% → 56% → 85% (Q1 2026). GAAP profitability was first achieved in 2023 and has expanded sharply. Gross margins are consistently above 79%, well above the ≥70% software benchmark.
⚠️ Material flag — SBC: SBC was $692M in 2024 (24% of revenue), up 45% from 2023’s $476M, and $684M in 2025. In Q1 2026, SBC was $201.6M. The GAAP vs. non-GAAP net income divergence from SBC materially exceeds the 10% threshold. In Q1 2025, adjusted income from operations was $391M vs. GAAP income from operations of $176M — a $215M gap attributable almost entirely to SBC. Investors relying on non-GAAP figures are seeing a fundamentally different profitability picture. SBC is a recurring economic cost of talent retention. It dilutes existing shareholders at approximately 3.24% per year in share count growth.
3.2 Growth
The revenue growth acceleration from 17% → 29% → 56% → 85% (Q1 2026) is exceptional and confirmed. GAAP net income growth is equally striking: $210M in 2023 → ~$1.46B in 2025 → $870.5M in Q1 2026 alone (roughly 4x Q1 2025’s $214M).
3.3 Software-Specific Metrics
RPO and cRPO (as of Q1 2026, confirmed): Total RPO was $4.45B, up from $1.90B a year prior — a 134% YoY increase. Critically, the appendix now provides the decomposition that was previously flagged as a critical gap: short-term RPO (converting within 12 months) was $1.75B; long-term RPO was $2.70B. The 39% short-term / 61% long-term split means the $4.45B RPO is weighted toward longer-dated commitments — a structural characteristic consistent with multi-year government contracts. The cRPO of $1.75B implies approximately $600–700M in quarterly revenue conversion, consistent with current revenue levels and supporting the forward demand picture without overstating near-term conversion.
NRR (confirmed — critical gap now closed): Net dollar retention was 150% in Q1 2026, as disclosed in the Q1 2026 Business Update appendix. This directly resolves the report’s previously most important missing data point. NRR of 150% means existing customers grew their revenue with Palantir by 50% on a trailing twelve-month basis — purely through expansion, before any new customer additions. Best-in-class enterprise software benchmarks are 120–130%. NRR of 150% at Palantir’s scale is exceptional and validates the AIP Bootcamp expansion thesis as producing genuine, measurable upsell rather than mere deal count.
FCF Margin (Q1 2026, confirmed): Adjusted FCF was $924.6M on $1.633B revenue — a 57% adjusted FCF margin. GAAP cash from operations was $899.2M — a 55% GAAP OCF margin. The gap between adjusted FCF ($924.6M) and GAAP OCF ($899.2M) reflects $32.9M in employer payroll taxes on SBC added back and $7.4M in property/equipment purchases — a narrow, clean reconciliation. FY2026 adjusted FCF guidance: $4.2–4.4B, implying approximately 58% adjusted FCF margin on the $7.65B revenue guidance midpoint.
⚠️ FCF qualification: GAAP OCF ($899M) is the more conservative and analytically correct measure. Even at the GAAP OCF level, the 55% margin is exceptional. The adjusted FCF figure adds back SBC-related employer payroll taxes that are real cash costs and should not be treated as non-economic.
Deal Velocity (Q1 2026, confirmed): 206 deals of $1M+, 72 of $5M+, and 47 of $10M+. U.S. commercial TCV of $1.18B (+45% YoY). U.S. commercial RDV of $4.92B (+112% YoY, +12% QoQ). These are not proxies for NRR — they are demand-side leading indicators that complement the confirmed 150% NRR.
Rule of 40 (Q1 2026, confirmed): 145%, calculated as 85% revenue growth + 60% adjusted operating margin. This is confirmed from Palantir’s own reconciliation table using the top 100 global companies by market cap as the peer universe. Among large-scale public software companies with revenues in the billions, this appears historically exceptional and has no obvious documented precedent in readily available peer data — but this specific claim has not been systematically verified across the entire software universe and should be treated as a strong directional signal rather than a confirmed historical record.
3.4 Financial Health
Palantir carries no meaningful debt. Cash, cash equivalents, and short-term U.S. Treasury securities stood at $8.0 billion as of Q1 2026 (as of Q1 2026 Business Update) — up from $3.9B as of Q1 2024. The balance sheet has more than doubled its net cash position in two years. This is fortress-grade: no leverage risk, no refinancing risk, no interest rate sensitivity on the liability side. At approximately $86–90M per quarter in Treasury income at current T-bill rates, interest income is a meaningful P&L contributor.
3.5 Cash Flow Quality
Q1 2026 GAAP cash from operations was $899M on $1.633B revenue — a 55% GAAP OCF margin. Q1 2025 GAAP OCF was $310M on $884M revenue — a 35% GAAP OCF margin. OCF margins are expanding faster than revenue.
The earnings quality ratio (OCF / GAAP net income) was $899M / $871M = 103% in Q1 2026, compared to $310M / $214M = 144% in Q1 2025. The compression from 144% to 103% requires explanation.
GAAP > Adjusted EPS Inversion — Now Diagnosed (confirmed from reconciliation table): In Q1 2026, GAAP EPS was $0.34 vs. adjusted EPS of $0.33. The reconciliation is: GAAP net income $870.5M + SBC $201.6M + employer payroll taxes on SBC $28.0M − income tax effects and adjustments $243.6M = adjusted net income $856.5M. The inversion is entirely explained by the income tax normalization methodology: Palantir’s adjusted EPS uses an estimated long-term annual effective tax rate of 23%, which produced a $243.6M tax addition in the adjusted calculation. Palantir’s actual Q1 2026 GAAP tax rate was substantially below 23% — consistent with continued utilization of deferred tax assets and SBC tax deductions — resulting in a lower GAAP tax charge and higher GAAP net income than the normalized adjusted figure. This has no connection to SCC mark-to-market gains or Treasury interest income. Both of those hypotheses were incorrect and are retracted. The earnings quality ratio compression from 144% to 103% reflects net income growing faster than OCF as GAAP tax charges remain below their normalized long-term rate — a real but transitional effect, not a structural quality concern.
Primary profitability signal: GAAP OCF remains the cleanest indicator of recurring operating performance. GAAP net income is confirmed real but includes a below-normalized GAAP tax rate that will likely normalize over time, creating a mild headwind to reported GAAP net income growth even as operations improve.
3.6 Audit Opinion
Palantir’s annual filings carry an Unqualified (Clean) Audit Opinion from Ernst & Young. No material weakness or going concern qualifications have been reported.
4. Competitive Position (Porter’s Five Forces)
4.1 Threat of New Entrants — Low to Medium
Building a data ontology platform that can ingest heterogeneous operational data across classified and unclassified environments, obtain U.S. government facility clearances, pass FedRAMP authorization, and develop the institutional trust to operate inside DoD workflows takes years and is not replicable quickly. The accumulated government relationships (Palantir has worked with U.S. defense agencies since 2004) constitute a moat that no VC-backed startup can shortcut. On the commercial side, the barrier is lower — Snowflake, Databricks, and Microsoft Fabric all compete in the data platform layer. But Palantir’s ontology layer (the conceptual model of objects and relationships that sits above raw data) is architecturally differentiated.
4.2 Competitive Rivalry — Medium
The market is not winner-take-all. In government analytics, Palantir competes with Leidos, CACI, Booz Allen Hamilton, and, increasingly, Microsoft (Azure Government). In commercial AI platforms, it competes with Databricks, Snowflake, Microsoft Fabric, and newer entrants like Scale AI. The rivalry intensity is moderate rather than extreme because Palantir targets integrations so deep and environments so complex that direct comparison-shopping is structurally difficult for buyers.
4.3 Threat of Substitutes — Medium, Increasing
The most credible substitution threat is not a direct competitor — it is the internal AI build-out trend. Large enterprises with sufficient ML engineering talent are increasingly building internal data infrastructure on open-source tools (dbt, Apache Iceberg, open-source LLM frameworks). For the government, budget pressure combined with off-the-shelf AI capabilities from major cloud providers (AWS Bedrock, Azure OpenAI Service) creates potential substitution risk at the margin, though not at the classified integration level. Palantir’s AIP positions it as an AI enabler rather than a displaced workflow, which reduces but does not eliminate this risk.
4.4 Bargaining Power of Suppliers — High (for Palantir)
Palantir is a major cloud customer of AWS, Azure, and GCP, and can negotiate favorably. Its primary “supplier” is talent, and high SBC is the cost of maintaining that leverage. The company has no single-source supplier dependencies.
4.5 Bargaining Power of Buyers — Medium
Government buyers have multi-year contract cycles that create lock-in, but they also have formal procurement processes, Congressional oversight, and periodic recompetes that create pricing pressure. Commercial buyers can theoretically switch, but the ontology migration cost is prohibitive in practice. Buyers cannot easily leave once deeply embedded, but new contract negotiations remain competitive.
5. Macro & Industry Environment
5.1 Recent Industry Policies / Regulations
The U.S. defense budget has been expanding in real terms, with AI readiness designated as a national security priority under both the prior and current administrations. U.S. government revenue grew 84% YoY to $687M in Q1 2026, accelerating from 66% in Q4 2025. The DOGE-era government efficiency initiatives have created headline noise, but Palantir’s exposure is to mission-critical AI infrastructure — Maven Smart System is being deployed across the Department of War, not discretionary IT spending. This is a meaningful distinction.
5.2 Regulatory & Antitrust Dynamics
No antitrust action against Palantir is currently documented. The company faces ongoing reputational scrutiny around civil liberties in its surveillance-related government contracts (ICE, law enforcement), but this has not translated into material contract cancellations or regulatory constraints on the business.
5.3 Macro & International Factors
Rising defense spending across NATO is a structural tailwind for Palantir’s international government business. Palantir’s $8.0B net cash position means rising rates are directionally positive for interest income, not a liability risk. The geopolitical fragmentation trend (sovereign AI infrastructure, defense AI investment) is a long-duration tailwind. Note: international revenue was approximately $351M in Q1 2026 vs. U.S. revenue of $1.282B — international growth is significantly slower and is not the primary investment thesis driver.
5.4 AI Impact Assessment
Palantir is positioned as the deployment layer for AI, not as a model developer. AIP’s value proposition is that customers have access to frontier models (GPT-4, Claude, Gemini) but lack the ability to run those models against proprietary operational data securely. Palantir provides the operational ontology that makes AI actionable. The confirmed NRR of 150% provides direct evidence that this positioning is translating into measurable customer value expansion. As model commoditization continues, falling model costs benefit Palantir without threatening it — the deployment layer becomes more valuable, not less.
5.5 Overall Assessment: Positive
6. Moat Analysis
6.1 Intangible Assets
Palantir’s government relationships and security clearances function as regulatory licenses. Competing for a classified DoD contract without pre-existing relationships, clearances, and past performance records is structurally disadvantaged. The brand within the U.S. intelligence community is unique and has grown over 20 years.
6.2 Switching Costs — Primary Moat
When an organization deploys Foundry or Gotham, it maps its entire operational data model — people, assets, processes, events — into Palantir’s ontology layer. Unwinding that integration is not a software migration; it is an organizational epistemology migration. The embedded workflows, dashboards, and decision loops create institutional muscle memory that is extremely costly to replace. The confirmed 150% NRR is the strongest available quantitative evidence that this moat is functioning as described — existing customers are not merely retaining; they are expanding aggressively.
6.3 Cost Advantages
GAAP operating margin expanded from 5% in FY2023 to 16%+ in FY2024 and 46% in Q1 2026. The cost structure is not growing proportionally with revenue. The company remains in an investment phase — AIP Bootcamp sales and marketing costs are still scaling — but operating leverage is already visible and accelerating.
6.4 Unique Resources
Twenty years of classified government project execution have produced proprietary engineering patterns and institutional knowledge that cannot be reconstructed from scratch. The NVIDIA partnership for Sovereign AI OS — combining Blackwell Ultra hardware with the full Palantir software suite — represents a new hardware-software integration vector that extends Palantir’s platform into air-gapped, on-premises deployment environments.
Moat Summary: The moat is real, deep, and durable in government. In the commercial, the confirmed NRR of 150% provides the first direct quantitative validation that the moat is functioning as described, but it has not yet been stress-tested through a full economic cycle or an enterprise IT spending downturn. The distinction matters for scenario analysis.
7. Valuation Analysis
7.1 Life Cycle Stage
Palantir is a late-stage growth compounder in transition: GAAP profitable, generating real FCF, with accelerating growth — but still in rapid platform expansion. It is too mature to be valued purely on EV/Revenue optionality and too fast-growing to be valued on stable earnings multiples. The appropriate anchor is EV/FCF with growth-adjusted context, supplemented by forward P/E on a normalized earnings basis.
7.2 Current Valuation Multiples
As of early May 2026: market cap ~$330B, trailing P/E ~155, forward P/E ~87, EV/EBITDA ~160, EV/FCF ~120. At an annualized Q1 2026 earnings run rate of ~$1.36/share and a stock price of $137, the forward earnings multiple is approximately 101x — still extremely elevated, but the denominator is moving fast as GAAP earnings accelerate.
⚠️ Tax normalization headwind: The current annualized GAAP EPS of ~$1.36 benefits from a below-normalized effective tax rate. As the GAAP tax rate normalizes toward the 23% level used in Palantir’s own adjusted EPS calculation, GAAP earnings will face a headwind even as operations continue improving. Investors should not assume the Q1 2026 GAAP net margin of 53% is sustainable at that level on a tax-normalized basis.
7.3 PEG Ratio and Growth Context
The reported PEG ratio is 1.78, calculated using consensus analyst growth estimates. A PEG below 2 is commonly considered reasonable for high-growth companies. However, consensus has been systematically wrong to the downside on Palantir for multiple consecutive quarters. If actual growth continues to exceed consensus, the effective PEG is lower — but that requires the growth trajectory to sustain, which is the central risk.
7.4 Peer Comparison
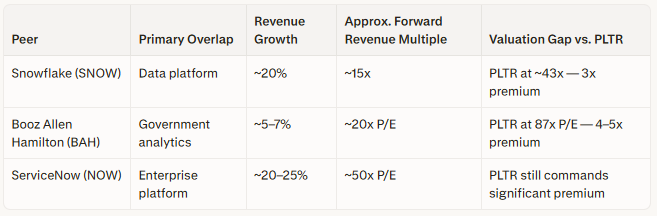
The BAH premium is justified only if U.S. commercial compounds into a durable revenue engine. The 133% U.S. commercial growth and 150% NRR represent the strongest available evidence that this is occurring.
7.5 Price Opinion
Overvalued on traditional metrics. The critical question is whether the growth rate represents a regime change or a peak.
✅ Confirmed: Revenue growth is accelerating. FCF margins are expanding. RPO growth outpaces revenue recognition. GAAP profitability is genuine. NRR is 150% — exceptional. The government pipeline is strengthening. U.S. commercial is now outgrowing the U.S. government at 133% vs. 84%.
⚠️ Assumption-dependent: Sustaining 50–85% revenue growth at $4–7B scale is historically unprecedented in enterprise software without consolidation. The AIP Bootcamp model drives rapid TCV — whether those relationships continue expanding at 150% NRR through a full economic cycle is not yet confirmed. The tax normalization headwind will create a growing gap between reported and normalized GAAP earnings even as operations improve.
❌ Cannot be justified: The claim that the current valuation is cheap or fair value. With a forward P/E of ~87 and EV/EBITDA of ~160, the stock is pricing in a multi-year continuation of exceptional growth. Describing it as undervalued requires growth assumptions at the upper tail of any reasonable distribution.
7.6 Implied FCF Growth — Reverse FCF Model
5-year horizon, FY2026–FY2031. All growth rates are expressed per share, incorporating a 3.24% annual dilution assumption consistent with SBC analysis in Sections 3.1 and 8. Over 5 years, this implies approximately 17% cumulative share count dilution.
Note: The 3.24% annual dilution rate is held constant for simplicity. In practice, dilution will vary inversely with share price — an appreciating stock reduces the dilution percentage, and a declining stock increases it.
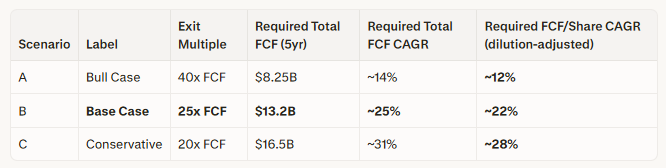
Scenario B is the appropriate base case. A 25x FCF exit multiple in 2031 represents a premium to mature software peers (20–30x) while assuming some normalization from current hyper-growth pricing. It requires 22% FCF per share CAGR over 5 years — ambitious but credible given current execution.
Scenario A’s 40x exit multiple assumes the market continues pricing Palantir as a high-growth platform well into the next decade. This is a bullish assumption, not a neutral baseline.
Conclusion: At $137/share, the stock is not pricing in science fiction. Under the base case (25x exit, 22% FCF/share CAGR required), the stock embeds demanding but achievable growth expectations given Palantir’s current trajectory. The margin of safety is thin: modest execution shortfalls or multiple compressions would materially impair returns.
FCF projections assume effective cash tax rates remain near current levels. Normalization toward the U.S. statutory rate (21%) would reduce FCF margins by an estimated 2–4 percentage points at steady state. This headwind applies to all three scenarios.
7.7 Entry Timing Assessment
Fundamental condition: RPO $4.45B (+134% YoY) with cRPO of $1.75B converting within 12 months. NRR of 150% confirmed. U.S. commercial growing 133% YoY. Rule of 40 of 145% confirmed. GAAP operating margin of 46%. These are unambiguously strong.
Price condition: The 52-week range is $114.90–$207.52, with the stock at approximately $137. Having pulled back ~34% from the 52-week high despite the strongest earnings in company history, the stock is in the lower half of its 52-week range. This is a technically interesting setup if the fundamentals are accepted as durable.
Downside scenario: If Q2 2026 revenue misses the $1.797–1.801B guidance midpoint and growth decelerates, a re-rating to 60x forward earnings implies a stock price of approximately $75–85 (a ~38–45% drawdown from $137). The range reflects uncertainty in the true recurring EPS base pending full tax normalization. This scenario requires only a deceleration to “very good but no longer extraordinary” growth — not a miss on profitability or a contract loss.
Position sizing guidance: A partial entry position of 3–8% of a diversified equity portfolio is defensible for long-duration, high-conviction investors who can tolerate a potential 40%+ drawdown to the $75–85 range. This reflects the strength of the fundamental acceleration while explicitly accounting for three remaining unresolved gaps (see Section 10).
Full sizing above 10% of the portfolio is not warranted until at least the EPS tax normalization trajectory and SCC portfolio carrying value are better understood. Investors with a horizon shorter than 3 years or lower volatility tolerance should size toward the lower bound or defer.
This recommendation is not a universal directive. It is a framework each investor must calibrate to their own risk constraints, conviction level, and time horizon.
8. Key Risks
Risk 1 — Valuation multiple compression. At ~87x forward P/E, any deceleration in growth guidance — even from 80% to 50% — could compress the multiple significantly. This is the largest near-term risk and is macro-independent.
Risk 2 — U.S. revenue concentration (78.5%). U.S. revenue represented $1.282B of $1.633B total in Q1 2026 — 78.5% of the business. This concentration is intensifying, not diversifying, as U.S. commercial accelerates. A U.S.-specific budget compression, post-election shift in government procurement, or enterprise IT freeze would affect nearly four-fifths of the revenue base simultaneously.
⚠️ Correlation note — Risks 2 and 4 are positively correlated: Under a U.S. spending compression scenario, both U.S. government revenue and commercial Bootcamp conversion rates would be stressed simultaneously. A U.S. enterprise IT freeze could cause Bootcamp clients to delay implementation even as new TCV is signed, inflating RPO without converting to near-term revenue, producing a deceptive leading indicator. Investors should treat a U.S. spending shock as a compound risk event activating both risks simultaneously, with multiplicative rather than additive impact.
Risk 3 — SBC dilution. Share count is growing at 3.24% annually. Combined with $684M in FY2025 SBC and $201.6M in Q1 2026 alone, shareholders bear a real economic cost that non-GAAP figures obscure. The dilution-adjusted FCF per share CAGR required to justify the current price (22% in the base case) is more demanding than the total FCF CAGR headline figure suggests.
Risk 4 — AIP Bootcamp NRR durability through a full cycle. The confirmed NRR of 150% is exceptional — but it reflects performance in a period of strong enterprise AI investment sentiment. Whether this level is sustainable through an enterprise IT spending downturn, when customers may freeze expansion rather than add workflow layers, is the pivotal unresolved question.
Risk 5 — Tax normalization headwind. Palantir’s current GAAP net income benefits from below-normalized effective tax rates due to deferred tax asset utilization and SBC deductions. As these are exhausted, GAAP net margins will face headwinds even as operations continue improving. The adjusted EPS reconciliation confirms a 23% long-term normalized tax rate vs. a materially lower current effective rate. A 2–4 percentage point FCF margin compression at steady state is a reasonable expectation.
Risk 6 — SCC portfolio earnings noise. The equity stakes Palantir holds from Strategic Commercial Contracts introduce mark-to-market volatility into the GAAP balance sheet and potentially the income statement. While the Q1 2026 EPS inversion has been diagnosed as tax-driven rather than SCC-driven, the SCC portfolio’s composition, carrying value, and fair value methodology remain opaque. As the portfolio grows, GAAP earnings will become noisier — potentially flipping the GAAP/adjusted relationship in either direction depending on mark-to-market movements in a given quarter. OCF remains the cleanest signal.
Risk 7 — International stagnation. International revenue was ~$351M in Q1 2026 vs. $1.282B U.S. revenue — international growth is significantly lagging. This is now a consequence of the U.S. concentration story (Risk 2) rather than an independent driver, but it limits the global diversification of the revenue base.
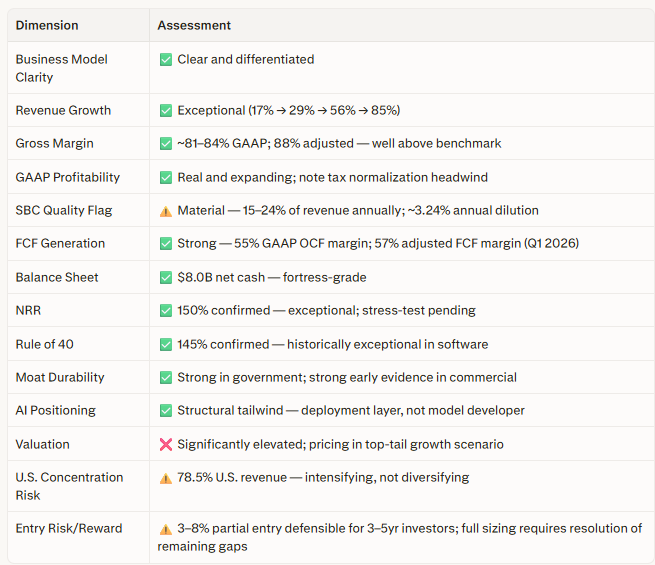
9. Summary Scorecard
10. Critical Gaps — Remaining Open Items
Three of the original four critical gaps have been resolved. One remains open, and two new gaps have been identified through the analytical process.
Gap 1 — NRR: RESOLVED. Net dollar retention was 150% in Q1 2026, confirmed from the Q1 2026 Business Update appendix. This is the most important positive update in this report.
Gap 2 — cRPO decomposition: SUBSTANTIALLY RESOLVED. Short-term RPO of $1.75B and long-term RPO of $2.70B are now disclosed. The 39/61 split is consistent with a government-heavy multi-year contract base.
Gap 3 — GAAP > Adjusted EPS inversion: RESOLVED. Driven entirely by the income tax normalization methodology, Palantir applies a 23% normalized long-term effective tax rate to adjusted EPS, while the actual GAAP tax rate was materially lower in Q1 2026 due to deferred tax asset utilization. Not SCC-driven, not Treasury-income-driven.
Gap 4 — SBC trajectory: ONGOING. SBC grew 45% in FY2024. Q1 2026 SBC was $201.6M. Whether SBC grows proportionally with revenue or decelerates as a percentage is essential to understanding GAAP profitability expansion. Monitor as % of revenue quarterly.
Gap 5 — Tax normalization trajectory. The gap between the current effective GAAP tax rate and the 23% normalized long-term rate is the primary variable affecting GAAP net margin sustainability. Monitoring the rate of deferred tax asset exhaustion is now a priority research item.
Gap 6 — SCC portfolio carrying value and fair value methodology. As the portfolio grows, understanding its composition and mark-to-market methodology is necessary to assess future GAAP earnings volatility. Not currently disclosed in sufficient detail.
Disclaimer: This analysis is for educational and informational purposes only and does not constitute investment advice. All investment decisions should be made with your own due diligence and, where appropriate, consultation with a qualified financial advisor. Past performance does not guarantee future results.