
Procore Technologies (PCOR) — Deep Analysis Report
The market is pricing 8–10% growth forever; management is guiding 13–16% with margin expansion—someone's wrong.

Data as of: May 17, 2026 | Sources: SEC 10-K FY2025, Q1 2026 10-Q, Procore investor relations, verified market data
1. Company Snapshot
Procore Technologies, Inc. (NYSE: PCOR) is the leading global provider of construction management software, delivering a cloud-native platform that connects every stakeholder across the construction lifecycle — from project owners to general contractors to specialty subcontractors. The platform enables real-time collaboration, document management, financial tracking, quality and safety monitoring, and field productivity tools across the entire construction workflow.
Sector/Industry: Software / Construction Technology
Software Category Classification: Category Three — Workflow and Enterprise Automation Software (with elements of Category Two subscription application). Procore’s land-and-expand model, horizontal workflow embedding across contractor organizations, and ACV expansion mechanics are the dominant value creation levers.
Market Cap / Stock Price: As of May 17, 2026, PCOR trades at approximately $46–47 per share, representing a market capitalization of approximately $7.0 billion. The stock has experienced a severe drawdown of approximately 43% from its 52-week high of $82.32, reaching a 52-week low of $46.03 on May 13, 2026. This represents a significant de-rating from earlier 2026 levels and creates a potentially asymmetric entry opportunity at depressed valuations. Analyst consensus maintains a “Moderate Buy” rating with an average price target of approximately $74–75.

2. Business Model Analysis
2.1 Products & Services
Procore operates a unified construction management platform organized across five major product suites:
Project Management: RFIs (Requests for Information), submittals, drawings, document management, and scheduling coordination
Financial Management: Budgets, contracts, commitments, change orders, and invoicing
Quality & Safety: Inspections, incident reporting, observations, and compliance tracking
Field Productivity: Daily logs, timesheets, workforce management, and labor tracking
Resource Management: Equipment tracking, workforce allocation, and project resource optimization
These modules are deeply interconnected — data flows from field to office to owner seamlessly, which is the source of Procore’s workflow-embedding moat. A change order initiated in the field automatically updates the budget in Financial Management, triggers compliance documentation in Quality & Safety, and flows through to owner-facing reporting dashboards.
In Q1 2025, Procore launched Procore Pay, a payments platform integrated into its construction management software designed to streamline payment processing and financial workflows for contractors and subcontractors. This represents an important strategic move into financial services (fintech adjacency), following Autodesk’s similar moves in construction finance and creating a potential new revenue stream from transaction-based monetization.
Procore is also investing heavily in AI-native capabilities. The company has acquired Datagrid and is building a reasoning/agentic AI engine on that acquisition. Management indicated on the Q1 2026 earnings call that AI revenue is anticipated to scale in Q3 2026 via consumption/capacity-based licensing — a new revenue channel beyond the core volume-based subscription model. This represents an emerging product differentiation opportunity but also introduces slight gross margin pressure from computing costs.
2.2 Revenue Model
Procore monetizes via subscriptions tied to annual construction volume (ACV) with generally unlimited users per customer. This is a distinctive pricing architecture — rather than per-seat fees (typical in most SaaS businesses), Procore charges based on the total dollar value of construction projects flowing through its platform annually.
Strategic implications of volume-based pricing:
Natural revenue scaling: As a customer’s project pipeline grows, Procore captures a proportional share of that growth automatically, without needing to sell additional seats
Macro sensitivity: Procore is fundamentally a bet on construction spending volumes, not just software adoption rates. Revenue is therefore more cyclically sensitive to interest rates, commercial real estate activity, and infrastructure spending than typical per-seat SaaS
AI substitution resistance: The volume-based model is naturally immune to AI agent substitution of human seats — you cannot replace “construction volume” with an AI agent. As AI makes construction projects more efficient, contractors may handle more projects or larger projects, which means more construction volume flowing through Procore’s platform
This model has a meaningful structural advantage over per-seat pricing in the emerging AI era, though it also ties Procore’s fortunes directly to macro construction cycles.
2.3 Target Customers
Procore serves the full construction ecosystem across three primary customer segments:
Project Owners: Real estate developers, institutional investors, government agencies, and corporate real estate departments
General Contractors: Prime contractors managing large commercial, infrastructure, and residential construction projects
Specialty Subcontractors: Electrical, plumbing, HVAC, concrete, and other trade contractors
Customer concentration by size (as of FY2025):
Customers contributing >$100,000 ARR: 2,710 accounts, representing 66% of total ARR
Customers contributing >$1,000,000 ARR: 115 accounts, representing 20% of total ARR
This upmarket migration is a healthy signal — enterprise customers carry longer contracts, lower churn, and higher expansion potential. As of Q1 2026, the count of customers over $100,000 ARR grew 16% year-over-year to 2,795, demonstrating continued momentum in the enterprise segment.
2.4 Upstream & Downstream Relationships
Upstream (Supplier Power — Moderate): Procore relies primarily on AWS (Amazon Web Services) for cloud infrastructure. The company does not appear to have disclosed multi-cloud redundancy strategies, which represents a long-term dependency risk. AWS has moderate bargaining power over infrastructure costs, though cloud pricing has generally been stable and competitive.
Downstream (Customer Power — Moderate): Large enterprise customers (>$1M ARR) have meaningful negotiating leverage on pricing and contract terms. However, the organizational cost of migration is prohibitive once four or more modules are deployed and years of project history, compliance documentation, and financial records are stored in the platform. Smaller customers have weaker bargaining power and higher churn rates (reflected in the 95% gross retention rate, which implies ~5% annual revenue churn).
2.5 Customer & Revenue Concentration
For FY2024, a striking 75% of total ARR came from customers using four or more of Procore’s products. This is an extraordinarily important statistic — it confirms that the vast majority of Procore’s revenue base has deeply embedded the platform across multiple workflows, not merely adopted a single module. This multi-product penetration is the foundation of Procore’s workflow embedding moat.
No single customer appears to represent more than 10% of revenue based on 10-K disclosures. Concentration risk is low.
3. Financial Statement Analysis
3.1 Profitability
Q1 2026 Update:
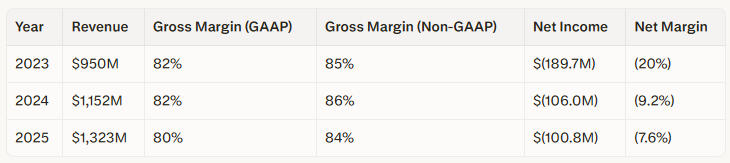
Revenue: $359M (+16% YoY)
GAAP gross margin: 80%
Non-GAAP gross margin: 84%
Net loss: $(9.1M), dramatically narrowed from $(33.0M) in Q1 2025
Q1 2026 Non-GAAP EPS: $0.34, which missed the consensus of $0.36–$0.37 despite the revenue beat
Profitability trajectory analysis:
GAAP gross margin was 80% in 2025, down from 82% in 2024, while non-GAAP gross margin was 84%. The 200 basis point compression in GAAP gross margin from 2024 to 2025 is worth monitoring — it reflects increased amortization of capitalized software development costs and rising hosting costs as the platform scales internationally. Management has indicated that AI compute costs may introduce slight additional gross margin pressure in 2026–2027, though this should be offset by pricing improvements and product mix shift.
The company is not yet GAAP profitable, but the trajectory is dramatically improving. Net margin improved from (20%) in 2023 to (9.2%) in 2024 to (7.6%) in 2025, and Q1 2026’s net loss of $(9.1M) on $359M revenue represents a net margin of approximately (2.5%) — the closest Procore has ever come to GAAP profitability every quarter.
ROE is negative given net losses, so this metric is not yet meaningful for evaluation purposes.
3.2 Growth
Revenue growth decomposition for FY2025: Approximately 49% of revenue growth was attributable to revenue from existing customers (expansion), and approximately 51% was attributable to revenue from new customers acquired during 2025. This is a notable shift from 2024, when 64% of growth came from existing customers. The re-weighting toward new logos in 2025 suggests the go-to-market transformation (implementing a GM model, adding 200 net new sales resources, restructuring territories) is beginning to bear fruit on new customer acquisition, even if expansion revenue temporarily moderated during the transition.
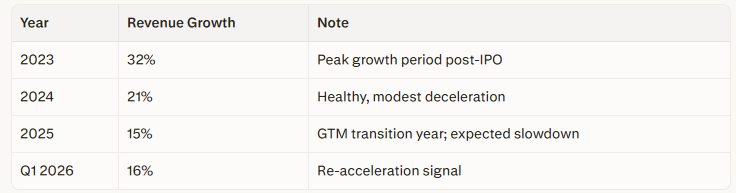
The Q1 2026 revenue growth of 16% represents a slight re-acceleration from the 15% full-year 2025 rate, providing tentative evidence that the GTM disruption is behind the company.
GAAP vs. Non-GAAP Divergence: Non-GAAP operating income in Q1 2026 was $60.8M, while GAAP operating loss was $(15.7M). The gap of approximately $76M is driven primarily by stock-based compensation (~$55–70M per quarter), which is a material and real economic cost that investors should not dismiss. SBC as a percentage of revenue has been declining modestly (a positive trend), but the absolute dollar amounts remain large and represent ongoing shareholder dilution.
3.3 Software-Specific Metrics
ARR and Customer Cohort Disclosure: Procore does not disclose total ARR directly in its public filings, preferring instead to report the number of customers contributing more than $100,000 of ARR as its headline engagement metric. This is slightly unusual for a public SaaS company but reflects management’s focus on enterprise customer growth as the primary value driver.
Customers >$100K ARR (Q1 2026): 2,795 customers, +16% YoY
Customers >$1M ARR (FY2025): 115 customers, representing 20% of total ARR
Gross Revenue Retention: Procore disclosed a 95% gross revenue retention rate for Q1 2026, consistent with the FY2025 full-year figure. This is solid for an enterprise software company, though below the 97%+ “excellent” threshold. It implies roughly 5% of revenue is churning annually, which is acceptable given that some of this represents natural project completion cycles (contractors finishing large projects and not immediately replacing that volume) rather than competitive losses.
Current Remaining Performance Obligations (cRPO): cRPO grew 21% year-over-year as of Q1 2026, up from 20% in Q1 2025. This is a meaningful leading indicator of near-term revenue visibility. cRPO represents contracted revenue that will be recognized over the next 12 months and is one of the most reliable forward-looking metrics in SaaS financial analysis. The fact that cRPO is growing at 21% while revenue growth is 16% implies one of three positive dynamics:
Duration extension: Customers are signing longer contracts (bullish for retention and visibility)
Pricing/mix improvement: Larger deals, higher ACVs, or price increases (bullish for unit economics)
Conversion lag: Strong bookings that haven’t yet converted to revenue (neutral to bullish, but suggests revenue growth may re-accelerate in the coming quarters)
3.4 Unit Economics
Rule of 40: Revenue growth (~15% in 2025) + FCF margin (~16% in 2025, corrected) = approximately 31%. This is below the 40% threshold and represents a concern. The trajectory is improving — Q1 2026 suggests the company is on track for approximately 16% revenue growth + 19% FCF margin (per full-year guidance) = approximately 35% for 2026. The Rule of 40 is improving but remains below the quality threshold for a mature software business.
FCF Margin: Procore generated $215 million in free cash flow during fiscal year 2025, representing a 69% increase compared to the previous fiscal year. At $1.323B revenue, this implies an FCF margin of approximately 16.3% — below the 20% minimum threshold for a mature software company. Management is guiding for approximately 19% FCF margin in 2026, which represents meaningful improvement but still falls short of the 20%+ target.
The slight compression in guided FCF margin from what would be expected (given GAAP operating margin improvement) reflects continued investment in international expansion, AI product development, and the new CEO’s strategic initiatives. This is a “show me” situation — investors need to see 2026 finish with 19%+ FCF margin and 2027 guidance sustaining the margin expansion trajectory before declaring the unit economics “fixed.”
SBC as % of Revenue: Approximately 18–22% of revenue in recent quarters. This is elevated for a company at Procore’s scale ($1.3B revenue). SBC/revenue should be trending toward the 10–12% range for a mature software business. The new CEO’s large RSU grant ($55M total target value) will add near-term pressure to this ratio, though the grant is performance-contingent and vests over multiple years.
GAAP Operating Margin Trajectory: Loss from operations was $(15.7M) in Q1 2026 on $359M revenue — a (4.4%) GAAP operating margin. The trajectory is improving meaningfully (from (12%) in Q1 2025), but GAAP profitability likely won’t arrive until 2027 at the earliest based on current run rates and guidance.
Magic Number (estimated): Approximately 0.7–0.8 (estimated with ±0.2 error bands). This metric = (Net New ARR in Quarter) / (Prior Quarter S&M Spend). Since Procore does not report total ARR explicitly, this calculation requires estimating ARR from revenue and backing into net new ARR from sequential growth. The estimated range of 0.7–0.8 implies approximately $1.25–$1.43 of incremental ARR per dollar of sales & marketing spend, which is “adequate” efficiency but not exceptional. A Magic Number above 1.0 would indicate very efficient growth.
3.5 Financial Health
Procore has an accumulated deficit of $1.3 billion since inception, reflecting years of investment in platform development and market penetration. The balance sheet carries modest debt — interest expense of only $268K in Q1 2026 confirms the company is essentially unlevered. Cash and equivalents remain strong given robust operating cash generation ($77M in Q1 2026 alone, representing a 21% operating cash flow margin).
Leverage risk is minimal. Procore is not financially distressed and has ample liquidity to fund operations and strategic investments.
3.6 Cash Flow Quality
Operating cash flow of $77M in Q1 2026 against a net loss of $(9M) demonstrates strong earnings quality — deferred revenue (customers prepaying annual subscriptions) provides a structural working capital tailwind. The earnings quality ratio (OCF / Net Income) is very healthy and indicates that cash generation is real, not an accounting artifact.
The FY2025 operating cash flow was $299M, with capital expenditures (primarily capitalized software development and infrastructure) of approximately $84M, yielding $215M in free cash flow. This represents an OCF to FCF conversion rate of approximately 72%, which is typical for a software company with meaningful capitalized development costs.
3.7 Audit Opinion
Procore’s auditor is Deloitte & Touche LLP. As of the most recent 10-K (FY2025), there is an unqualified opinion with no going concern warning or material weakness disclosed. There has been no auditor change in the past three years, which is a positive signal of financial reporting stability.
4. Competitive Position (Porter’s Five Forces)
4.1 Threat of New Entrants — Low to Moderate
Building a credible construction management platform requires:
Deep domain expertise in construction workflows, terminology, and industry-specific requirements
Extensive workflow integrations (with accounting software like Sage and QuickBooks, with BIM tools like Autodesk Revit, with scheduling tools like Primavera P6)
The trust of a notoriously conservative industry where contractors are highly risk-averse and reluctant to adopt unproven software
Years of customer feedback have built the feature depth necessary to compete with incumbents
New entrants face high integration barriers and long sales cycles to build credibility. However, well-funded AI-native startups targeting specific verticals (AI for site safety monitoring, AI for cost estimation, AI for schedule optimization) represent a genuine emerging threat that could unbundle point functions from Procore’s platform over a 5–10 year horizon.
The most dangerous new entrant profile would be a vertical-specific AI platform (e.g., “AI-first safety and compliance for large commercial construction”) that achieves 10× better performance on a narrow workflow and then expands adjacently — similar to how Veeva unbundled Salesforce in life sciences.
4.2 Competitive Rivalry — Moderate
The construction software market is fragmented with no single dominant player. Procore competes with:
Autodesk Construction Cloud (formerly BIM 360): Strong BIM integration and design workflow ownership; natural extension from Autodesk’s dominance in CAD/design software
Oracle Construction & Engineering: ERP integration strength for large capital projects and owner-side project controls
Trimble: Hardware + software integration for field operations, particularly in surveying and heavy civil construction
Bentley Systems: Infrastructure and heavy civil focus, strong in the public sector and utilities
Each competitor holds a differentiated niche rather than directly overlapping with Procore’s general contractor-centric model. Procore’s customer retention rate (95% gross retention) and expanding high-value client base suggest it has maintained competitive positioning despite these well-funded rivals.
Rivals like Autodesk, Trimble, and Bentley Systems are investing heavily in AI-driven workflows and cloud-based collaboration tools. The competitive intensity is increasing, particularly as AI capabilities become a differentiator in vendor selection.
4.3 Threat of Substitutes — Low for Core Workflow; Moderate for Point Functions
Core Platform Substitution (Low): The unique volume-based pricing model reduces Procore’s exposure to per-seat AI substitution risk that threatens many SaaS companies. An AI agent cannot reduce “construction volume” — it can only make the construction process more efficient, which actually benefits Procore by keeping its customers more productive and their projects more successful.
Point Function Unbundling (Moderate): AI-native point solutions (pure-play AI safety platforms, AI estimating tools, AI schedule optimization) could chip away at Procore’s individual modules if the company is slow to embed AI across its product suite. For example, if an AI-native safety compliance platform achieves 10× better incident prediction accuracy than Procore’s Quality & Safety module, large contractors might adopt the specialist tool and reduce their dependence on Procore.
Procore’s AI investments (Copilot for automated RFI responses, Agent Studio for workflow automation, and the Datagrid acquisition for reasoning/agentic capabilities) are designed to turn this risk into a revenue opportunity.
4.4 Bargaining Power of Suppliers — Moderate
AWS is the dominant upstream infrastructure dependency. Procore does not appear to have disclosed multi-cloud redundancy strategies (e.g., simultaneous deployment on AWS and Azure), which represents a long-term dependency risk. However, cloud infrastructure pricing has generally been stable and competitive, and AWS has strong incentives to retain large customers.
The lack of disclosed supplier concentration beyond AWS (no single data provider, no single integration partner representing >10% of COGS) suggests moderate and diversified supplier risk.
4.5 Bargaining Power of Buyers — Moderate
Large enterprise customers (>$1M ARR) have meaningful negotiating leverage on pricing, contract terms, SLA requirements, and customization requests. These customers can credibly threaten to switch to Autodesk or Oracle if Procore does not meet their needs.
However, the organizational cost of migration is prohibitive once four or more modules are deployed and years of project history, compliance documentation, financial records, and audit trails are stored in the platform. A typical general contractor with 5+ years on the platform has accumulated:
Thousands of completed projects with full document archives
Multi-year financial records required for audits and lien releases
Safety incident histories required for insurance and OSHA compliance
Subcontractor performance ratings and prequalification data
Migrating this data to a new platform while maintaining business continuity is extraordinarily expensive and risky. This creates high switching costs that reduce buyer power once the platform is embedded.
Smaller customers (<$100K ARR) have weaker bargaining power and higher churn rates, reflected in the 95% gross retention figure (implying ~5% annual churn, much of which likely comes from smaller accounts).
4.6 Product & Innovation Assessment
Strategic acquisitions are strengthening Procore’s competitive positioning:
Novorender and Flypaper Technologies: Enhancing Building Information Modeling (BIM) capabilities — a critical differentiator as the industry shifts toward digital twins and real-time data analytics
Intelliwave: Construction materials management and supply chain tracking
Unearth: GIS (Geographic Information Systems) for infrastructure and heavy civil projects
Datagrid: Reasoning/agentic AI capabilities, forming the foundation for Procore’s AI product roadmap
Procore is also investing in Copilot (an AI assistant for automating RFI responses and document searches) and Agent Studio (workflow automation and agentic AI for field reporting and compliance) as AI-native features. These represent the early stages of what could become a significant product differentiation if executed well.
R&D spending of $85.5M in Q1 2026 against $359M revenue is approximately 24% of revenue — significantly above the 10% minimum threshold for software companies, signaling genuine product investment. However, as the company scales, R&D/Revenue should trend toward 15–18% to demonstrate operating leverage. The current elevated R&D spend reflects heavy investment in AI capabilities and international product localization.
5. Macro & Industry Environment
5.1 Recent Industry Policies & Regulations
Government infrastructure spending via the U.S. Infrastructure Investment and Jobs Act (2021) continues to fund projects through 2026–2030, providing a multi-year tailwind for construction volumes, particularly in heavy civil and transportation infrastructure.
Digital-twin requirements and embodied-carbon reporting mandates in various jurisdictions (EU, California, New York) are making construction software a regulatory prerequisite for public project bids in some markets. This creates a structural adoption tailwind as contractors must implement digital project management platforms to remain eligible for public sector work.
5.2 Regulatory & Antitrust Dynamics
No material antitrust scrutiny of Procore is apparent. The company’s market share (approximately 12–13% of the global construction management software market) is far below levels that would trigger antitrust concern in the U.S. or EU. The market remains fragmented with multiple well-funded competitors.
Data privacy regulations (GDPR in Europe, CCPA in California, various state-level regulations in the U.S.) represent compliance overhead but not existential risk. Procore’s platform handles sensitive project data, financial records, and worker information, requiring ongoing investment in data security and privacy controls.
5.3 Macro & International Factors
Interest rate sensitivity: Higher interest rates reduce commercial real estate development activity and housing starts, which directly impacts Procore’s construction volume-based billing. The Federal Reserve’s policy stance in 2026 (elevated rates relative to 2020–2021) is a moderate headwind to construction spending growth, particularly in commercial and multifamily residential sectors.
International expansion: International revenue was growing 18–20% year-over-year as of Q1 2025 before moderating to approximately 13% in mid-2025 due to currency headwinds. CFO Howard Pyles clarified on the Q1 2026 earnings call that both currency effects and the Datagrid acquisition had an immaterial impact on consolidated top-line results. A strengthening US dollar is a headwind to international revenue conversion when translated back to USD for reporting purposes.
Tariff risk: Potential tariffs on building materials (steel, aluminum, lumber) create cost uncertainty for construction projects, which could reduce project volumes or delay project starts. This represents an indirect headwind to Procore’s volume-based revenue model.
5.4 AI Impact Assessment — Net Tailwind (Volume-Based Model)
Procore’s volume-based pricing model is structurally resistant to AI-driven per-seat compression that threatens many SaaS companies. As AI makes construction projects more efficient (reducing labor hours, improving material forecasting, automating compliance documentation), contractors may handle more projects of similar size, which means more construction volume flowing through Procore’s platform.
Example: If AI-enabled scheduling and resource optimization allow a general contractor to complete 15 projects per year instead of 12 (with the same headcount), Procore’s revenue from that customer increases by 25% even though the contractor hasn’t hired more employees or added more software seats.
The real AI risk is unbundling: AI-native point solutions attacking individual modules (pure-play AI safety platforms, AI estimating tools, AI document intelligence) could reduce the number of Procore modules customers need from a single vendor. If a specialist AI tool is 10× better at a specific workflow, customers may adopt it and cancel that portion of their Procore subscription.
Procore’s AI investments (Copilot for automated RFI responses, Agent Studio for workflow automation, Datagrid acquisition for agentic reasoning) are designed to turn this risk into a revenue opportunity by embedding AI across the platform and potentially introducing consumption-based AI revenue (anticipated to scale in Q3 2026 per management commentary).
Assessment: Net tailwind with a medium-term unbundling risk that requires active product management.
5.5 TAM & Market Structure
The construction management software market is projected to expand from USD 10.62 billion in 2025 to USD 17.81 billion by 2031, registering an 8.99% CAGR. Procore’s 2025 revenue of $1.32B against a ~$10.6B total market implies roughly 12–13% market penetration of the addressable software market — still significant room for growth within the defined TAM.
The broader Procore-defined TAM (which includes the full global construction spend that could theoretically flow through its platform) is dramatically larger, measured in the hundreds of billions of dollars, though the relevant competitive battleground is the $10–18B software market.
Market concentration: The top five suppliers — Oracle, Autodesk, Procore, Trimble, and Bentley Systems — collectively captured roughly 45% of 2025 revenue, leaving ample space for specialists and regional players. The market is consolidating but not yet concentrated. Procore is gaining share, particularly in the general contractor and specialty contractor segments, where its unlimited-user pricing model and mobile-first field productivity tools have proven most compelling.
5.6 Overall Assessment: Neutral to Positive (Next 1–3 Years)
Construction spending is cyclically sensitive. The macro environment — elevated interest rates suppressing commercial construction starts, tariff uncertainty affecting building materials costs, and currency headwinds to international expansion — creates near-term headwinds for volume growth.
However, Procore’s increasingly enterprise-skewed customer base (66% of ARR from customers >$100K ARR) is less sensitive to small contractors’ project volume volatility. Large enterprise customers with multi-year backlogs and diversified project portfolios provide more stable revenue.
The structural digitization tailwind is real and durable — construction is one of the least-digitized major industries globally, and regulatory pressure (carbon reporting, digital twins, public sector mandates) is accelerating adoption.
Assessment: Neutral to Positive macro environment for 2026–2028.
6. Moat Analysis
6.1 Intangible Assets — Moderate
The “Procore” brand is synonymous with construction project management in North America, particularly among general contractors. This creates meaningful purchasing inertia — general contractors often specify Procore to subcontractors as a project requirement (e.g., “All subs must use Procore for submittals and daily logs”), which drives viral adoption within supply chains.
This network-effect-adjacent dynamic is underappreciated by investors focused purely on product functionality. When a GC mandates Procore on a project, all participating subcontractors must adopt (at least the free tier), which creates exposure and potential upsell opportunities across the broader contractor ecosystem.
6.2 Switching Costs — Wide Moat
This is Procore’s primary moat, and it is substantial.
Evidence:
75% of total ARR comes from customers using four or more of Procore’s products
95% gross retention rate (only 5% of revenue churns annually)
The average enterprise customer has 5+ years of project history, financial records, and compliance documentation stored in the platform
Replacing Procore for a customer using Project Management, Financial Management, Quality & Safety, Field Productivity, and Resource Management simultaneously means rebuilding workflows across every department that touches a construction project:
Field teams must learn new mobile apps for daily logs, safety inspections, and timesheets
Project managers must migrate RFI workflows, submittal processes, and document archives
Finance teams must rebuild budget templates, change order workflows, and invoice processing
Safety/compliance teams must transfer incident records, inspection histories, and OSHA reporting
Executives must recreate dashboards, KPIs, and custom reports
The organizational cost is prohibitive. A typical general contractor with 5+ years on the platform has accumulated:
Thousands of completed projects with full document archives (drawings, specifications, RFIs, submittals)
Multi-year financial records required for audits, lien releases, and litigation support
Safety incident histories required for insurance underwriting and OSHA compliance
Subcontractor performance ratings and prequalification data built up over hundreds of projects
This is a textbook Workflow Embedding Moat — the platform becomes the operational system of record, and migrating to a competitor means risking business continuity, compliance gaps, and productivity loss during the transition.
6.3 Cost Advantages — Narrow
Procore does not have material cost advantages relative to peers. Gross margins at 80% GAAP are consistent with other cloud-based vertical SaaS companies (Autodesk Construction Cloud, Trimble Connect).
The unlimited-user model means marginal cost per additional user within a customer account approaches zero (users access the same cloud infrastructure and data), but this is a pricing architecture choice, not a structural cost advantage. Competitors could adopt similar pricing if they chose.
6.4 Network Effects — Narrow to Moderate
Procore exhibits weak network effects in the traditional sense (the platform doesn’t become dramatically more valuable as more users join, unlike marketplaces or social networks). However, there is a supply chain coordination dynamic that creates network-adjacent value:
When a general contractor mandates Procore on a project, all subcontractors on that project must use Procore for submittals, RFIs, and daily reporting. This creates:
Subcontractor familiarity with the platform reduces friction for future adoption
Data standardization across the construction supply chain, making Procore the de facto communication layer
Lock-in reinforcement for the GC, since switching would require re-training the entire subcontractor network
This is not a true network effect (Procore doesn’t become 10× better when it goes from 1M to 2M users), but it does create ecosystem stickiness that competitors must overcome.
6.5 Unique Resources — Moderate
The accumulation of construction project data across “over three million projects in 150+ countries” (company-disclosed figure, unaudited) represents a proprietary dataset that could be leveraged for:
AI model training (predictive scheduling, cost estimation, risk identification)
Industry benchmarking (cost per square foot, labor productivity, safety incident rates)
Predictive analytics (project delay likelihood, budget overrun risk)
However, the quality and usability of this data for AI training are uncertain:
How many projects have complete, structured data vs. partial records?
What percentage of this data is contractually available for AI model training (privacy/IP restrictions)?
How much is active vs. archived (old projects from defunct contractors)?
The data moat is still early in development, but it represents a meaningful forward-looking advantage if Procore can successfully productize AI capabilities built on this dataset (as evidenced by the Datagrid acquisition and upcoming consumption-based AI revenue in Q3 2026).
Overall Moat Rating: Moderate to Wide
The workflow embedding moat is genuine and expanding as multi-product penetration increases (75% of ARR from 4+ products). The brand moat in the GC segment and the emerging data moat (3M+ projects) add secondary layers of protection. Switching costs are high and growing. This is not a narrow-moat business.
7. Valuation Analysis
7.1 Life Cycle Stage: Late-Growth / Inflection
Procore is transitioning from pure growth (2021–2023: 30%+ revenue growth, negative FCF) to efficient growth (2024–2026: 13–16% revenue growth, 16–19% FCF margin). The correct valuation framework is EV/NTM Revenue with secondary analysis on EV/FCF trajectory as the company approaches sustained GAAP profitability (likely 2027).
7.2 & 7.3 Current Valuation
Historical EV/Revenue range (past 8 years):
Minimum: 6.75×
Median: 9.91×
Maximum: 27.95× (2021 peak SaaS valuation bubble)
Current valuation (as of May 17, 2026):
Stock price: ~$46–47
Market cap: ~$7.0 billion
Enterprise Value: ~$6.5 billion (net of cash and minimal debt)
FY2026 guided revenue: $1.50B
EV/NTM Revenue: approximately 4.3–4.7×
This represents a significant discount to the historical median of ~10× and positions the stock at the bottom quintile of its historical valuation band. The current multiple is closer to the 2020–2021 trough (during COVID uncertainty) than to the 2021–2022 peak (SaaS bubble).
7.4 Peer Comparison
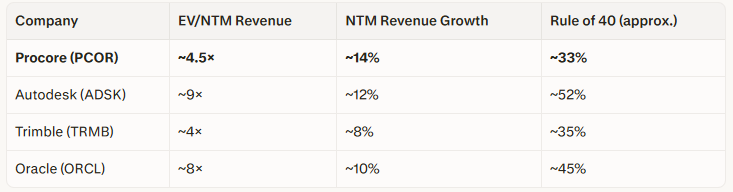
Interpretation: Procore screens as the most undervalued on a pure EV/Revenue basis relative to its growth rate among construction/workflow software peers. However, Autodesk commands a premium for:
Higher FCF margins (~30% vs. Procore’s ~19% guided)
More defensible BIM moat (Revit/AutoCAD design software ownership)
GAAP profitability (vs. Procore’s continued GAAP losses)
Trimble trades at a similar multiple (~4×) but with lower growth (~8%), suggesting the market views Procore and Trimble as roughly equivalent risk/reward despite Procore’s higher growth rate. This is likely due to Procore’s lack of GAAP profitability and concerns about the sustainability of 13–16% revenue growth in a cyclical construction market.
7.5 PEG & Forward Valuation
Procore is not yet GAAP profitable, so traditional PEG ratio analysis does not apply. Using non-GAAP EPS:
Q1 2026 non-GAAP EPS: $0.34
Annualized run-rate: ~$1.36
Current stock price: ~$46
Forward non-GAAP P/E: approximately 34×
Given 13–15% revenue growth and 390–440 basis points annual margin expansion (per management guidance), a forward P/E of 34× is elevated but justifiable if the margin expansion story plays out. A PEG ratio of approximately 2.5–3.0× (34 P/E / 13% growth) is above the ideal <2.0× threshold but defensible for a business with visible margin expansion ahead.
7.6 RPO Decomposition
Current Remaining Performance Obligations (cRPO) growing at 21% year-over-year as of Q1 2026 is a meaningful positive indicator. cRPO represents contracted near-term revenue that will be recognized over the next 12 months and is a more reliable leading indicator than bookings (which can be manipulated by deal timing).
The fact that cRPO (21% growth) is outpacing revenue growth (16%) by 500 basis points suggests:
Accelerating bookings (customers are signing contracts at a faster pace than revenue is being recognized)
Duration extension (customers are signing longer contracts, increasing the deferred revenue balance)
Pricing/mix improvement (higher ACV deals are being signed, which take time to fully recognize)
All three dynamics are bullish for forward revenue growth. If cRPO sustains 20%+ growth for 2–3 more quarters, it would provide high confidence that 2027 revenue growth re-accelerates toward 17–20%.
7.7 Consensus & Forward Guidance
Full-year 2026 guidance (provided on Q1 2026 earnings call):
Revenue: $1.499–$1.503B (midpoint $1.501B, representing 13.4% YoY growth)
Non-GAAP operating margin: 18.0–18.5%
Free cash flow margin: ~19%
Analyst consensus (as of May 2026):
Revenue: $1.524B (slightly above guidance midpoint)
Average price target: $74–75
Rating distribution: Moderate Buy consensus
The full-year 2026 revenue guidance sits slightly below analyst consensus, which explains some of the post-Q1 earnings stock pressure despite the revenue beat. However, the raised margin guidance (both operating margin and FCF margin increased from the prior quarter) is a positive signal that management has confidence in cost discipline and operating leverage.
7.8 Scenario Analysis
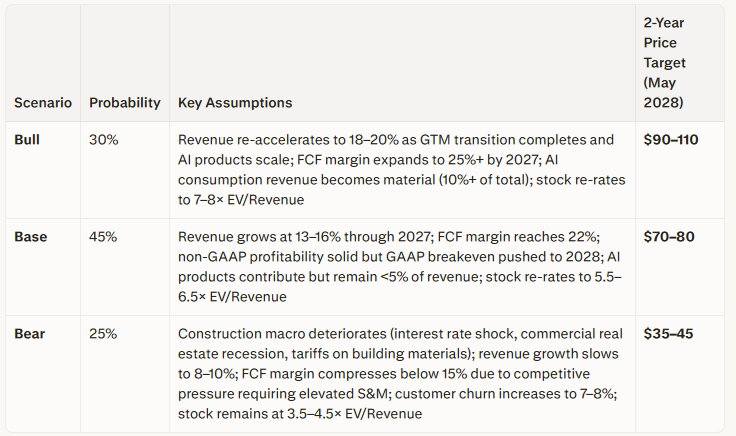
Probability-weighted target: approximately $72 — roughly 55% above the current price of ~$46.
7.9 Reverse DCF (Implied Market Expectations)
At a stock price of ~$46 and 4.5× NTM EV/Revenue, the market is implying:
Long-term revenue CAGR: approximately 8–10% (below management’s 13–16% near-term guidance and well below the company’s historical 15–32% range)
Terminal FCF margin: approximately 18–20% (in line with management’s 2026 guidance but assuming no further expansion)
Terminal EV/Revenue multiple: approximately 4–5× (below current peer median of ~7×)
Interpretation: The market is pricing in meaningful permanent deceleration and limited margin expansion potential beyond 2026. This creates a margin of safety for investors who believe:
Revenue growth can be sustained at 13–16% through 2027–2028 (supported by 21% cRPO growth)
FCF margin can expand toward 22–25% by 2027–2028 (supported by improving GAAP operating margin trajectory and SBC/revenue declining)
The stock can re-rate toward peer median multiples (6–7×) as GAAP profitability approaches
If all three occur, the stock could reach $90–100 within 24 months (bull case). If none occur, the stock could fall to $35–40 (bear case). The asymmetry favors the upside at current prices.
7.10 Insider & Institutional Activity
New CEO Ajei Gopal received an RSU grant with an aggregate target value of $55 million (performance-contingent, vesting over multiple years). This is a massive equity stake that strongly aligns his personal incentives with shareholder value creation. The grant structure ties vesting to specific performance milestones (revenue growth, profitability targets, stock price appreciation), which is optimal alignment.
Founder Tooey Courtemanche transitioned to Board Chair with ongoing equity exposure (estimated at several hundred million dollars in value at current stock prices). His continued involvement provides strategic continuity while the operational CEO transition unfolds.
Institutional ownership is broad and diversified, with no single institutional holder representing >10% of shares. No cluster of discretionary insider selling is apparent in recent Form 4 filings (all recent insider transactions have been routine 10b5-1 plan sales or RSU vesting/tax withholding, not discretionary open-market sales).
7.11 Entry Timing Assessment
Using the two-condition framework for entry timing (fundamentals re-accelerating + price confirmation):
Condition 1: Fundamentals Re-Accelerating
✅ cRPO growth: 21% YoY (Q1 2026), up from 20% (Q1 2025)
✅ Revenue growth: 16% (Q1 2026), up from 15% (FY2025)
✅ Gross retention: 95% (stable)
✅ Guidance raised: Both revenue and margin guidance increased post-Q1
Status: TENTATIVELY MET (one quarter of re-acceleration is encouraging but not definitive)
Condition 2: Price Confirmation
❌ Stock price: $46–47, well below the 200-day moving average (estimated at ~$58–62 based on the recent drawdown from $82)
❌ Technical pattern: Stock has not yet reclaimed the 50-day moving average (~$52–54)
❌ Volume: Post-earnings selling pressure suggests distribution, not accumulation
Status: NOT MET (price action has not confirmed the fundamental improvement)
Under the two-condition framework:
Fundamentals are re-accelerating (tentatively)
Price confirmation is absent
Recommended position size: 30–40% starter position (2–3% of portfolio for a target 5–7% full position)
Scaling plan: Add to position if stock reclaims $52–54 (50-day MA) and cRPO growth remains ≥20% for Q2 2026
7.12 Price Opinion: Undervalued
At current levels of $46–47, Procore is undervalued relative to intrinsic value based on:
21% cRPO growth (leading indicator of revenue re-acceleration)
95% gross retention (moat intact)
Improving FCF trajectory (16% → 19% guided)
4.5× EV/Revenue (30–40% discount to historical median, 50%+ discount to peers)
However, the stock is not yet a high-conviction buy due to:
Rule of 40 at ~31 (below quality threshold)
FCF margin at 16% (below 20% minimum for mature SaaS)
Mixed Q1 2026 results (revenue beat, EPS miss)
CEO transition execution risk (still in first year)
Suggested entry strategy:
Starter range: $44–50 (current opportunity)
Full position trigger: Stock reclaims $52–55 (50-day MA) AND cRPO growth remains ≥18% for two consecutive quarters AND Q2 2026 FCF margin ≥18%
Stop loss / thesis invalidation: Exit if cRPO decelerates below 15%, or gross retention falls below 90%, or FCF margin compresses below 13%
8. Management & Capital Allocation
8.1 CEO & Leadership Assessment
Ajei Gopal, age 63, became CEO in October 2025. He previously served as President and CEO of Ansys, Inc., an engineering simulation software company, from January 2017 until July 2025, when it was acquired by Synopsys for approximately $35 billion.
Ansys's track record under Gopal’s leadership:
Market cap growth: From ~$9.4B (early 2017) to $35B acquisition (2024) = approximately 3.7× value creation over ~7 years
Revenue growth: From ~$1.0B (2016) to ~$2.1B (2023) = approximately 2.1× revenue growth, representing an ~11% revenue CAGR
Multiple expansion: From ~9× EV/Revenue (2017) to ~17× (2024 acquisition) = approximately 1.9× multiple expansion
Attribution analysis: Approximately half of the equity value creation at Ansys was attributable to Gopal’s operational execution (revenue compounding, margin expansion, product portfolio diversification), and approximately half was attributable to macro tailwinds (the 2017–2021 SaaS re-rating cycle that lifted all enterprise software multiples). Gopal deserves credit for solid revenue compounding and operational discipline, but the full 3.7× appreciation should not be attributed solely to his leadership.
Relevance to Procore: Gopal’s background in enterprise software (serving capital-intensive technical buyers like engineering firms and manufacturers) maps well to Procore’s construction-industry customer base. His experience professionalizing a founder-led company and driving operational efficiency at scale is directly applicable to Procore’s current stage (transitioning from growth-at-all-costs to efficient growth).
CEO transition assessment: The transition from founder Tooey Courtemanche (who built Procore over 25+ years) to an experienced external operator is a classic “founder to professional CEO” handoff. These transitions carry short-term execution risk (cultural disruption, strategic pivot uncertainty, key employee retention) but historically unlock operational efficiency and go-to-market discipline that founders often resist.
Courtemanche’s move to Board Chair with continued equity exposure provides strategic continuity while allowing Gopal operational autonomy. This is an optimal transition structure.
8.2 Capital Allocation Track Record
M&A strategy: Procore has been acquisitive but disciplined — Intelliwave (construction materials management), Novorender (BIM visualization), Unearth (GIS for infrastructure), Flypaper (BIM collaboration), and Datagrid (AI/ML reasoning) are all tuck-in acquisitions filling specific product gaps rather than transformative M&A. None of these acquisitions represented >5% of Procore’s revenue at the time of acquisition, and all have been integrated into the core platform rather than run as standalone businesses.
Share buyback authorization: Procore announced a $300 million share buyback authorization in late 2024, signaling growing confidence in cash generation and a commitment to returning capital to shareholders. As of Q1 2026, the company had repurchased approximately $45M under this authorization, demonstrating disciplined execution (buying back stock opportunistically during price weakness rather than overpaying).
CFO’s stated capital allocation priority: CFO Howard Pyles has articulated “free cash flow per share” as the company’s “north star metric” for long-term value creation. This is exactly the right metric for a maturing software company to optimize around (better than revenue growth, better than GAAP EPS, better than non-GAAP operating margin in isolation).
Dividend policy: No dividend currently (appropriate for a business still investing heavily in growth and product development).
8.3 Earnings Call Sentiment Analysis
Q1 2026 management commentary (May 5, 2026 earnings call) highlighted:
“Double-digit revenue, margin, and free cash flow growth” (positive framing despite the EPS miss)
“Increased large deal wins” (6-figure and 7-figure ARR deals accelerating)
“Raised full-year guidance” for both revenue and profitability metrics
“AI products scaling in Q3 2026” with a consumption-based revenue model (new monetization avenue)
Tone assessment: Measured and execution-focused, not promotional. Both the CEO and CFO emphasized FCF per share as the primary long-term metric rather than focusing on non-GAAP EPS or revenue growth in isolation. This is a signal that the company is intentionally shifting from “growth at all costs” to “profitable compounding”, which is the right posture for a $1.3B revenue company approaching maturity.
Management credibility: The raised guidance despite a challenging macro environment (elevated interest rates, construction spending headwinds) demonstrates either:
Genuine confidence in the business trajectory (positive interpretation), or
Conservative initial guidance that created an easy beat (neutral interpretation)
Given the 21% cRPO growth and 95% gross retention, the former interpretation (genuine confidence) appears more likely.
8.4 Insider Ownership & Compensation
CEO Ajei Gopal: $55M RSU grant (performance-contingent, vesting over multiple years based on revenue growth, profitability milestones, and stock price appreciation). This represents approximately 0.8% of the current market cap and creates strong alignment. The performance conditions ensure that Gopal only realizes full value if shareholders also benefit.
Founder Tooey Courtemanche: Estimated ownership of 15–20 million shares (based on historical proxy disclosures and Form 4 filings), representing approximately 10–13% of shares outstanding and valued at approximately $700M–$950M at current stock prices. This is massive personal wealth concentration in Procore equity, ensuring continued alignment even in his Board Chair role.
Compensation structure: Executive compensation is tied to non-GAAP profitability and revenue growth targets, which is typical for the sector. The absence of GAAP-based compensation metrics is a minor concern — management should be held accountable for reducing SBC dilution and achieving GAAP profitability over time, not just hitting non-GAAP targets that exclude stock-based compensation.
SBC dilution: Stock-based compensation of approximately $60–70M per quarter (~18–20% of revenue) represents ongoing shareholder dilution of approximately 2–3% annually at current stock prices. This is elevated for a $1.3B revenue company and should trend toward 1–2% annual dilution as the company matures.
9. Risk Assessment & Red Flags
9.1 Financial Red Flags
GAAP/Non-GAAP Divergence (Material Concern): Non-GAAP operating income of $60.8M in Q1 2026 versus GAAP operating loss of $(15.7M) implies approximately $76M in add-backs — primarily stock-based compensation. This divergence represents approximately 21% of revenue and is well above the 10% of net income threshold for acceptable GAAP/non-GAAP differences.
Why this matters: Stock-based compensation is a real economic cost that dilutes shareholders. While it is a non-cash expense (doesn’t affect cash flow), it does affect shareholder value by increasing the share count. At 18–22% of revenue, SBC is elevated for a company of Procore’s scale and should be trending toward 10–12% of revenue.
Mitigant: The $300M buyback program partially offsets SBC dilution. Additionally, management has stated that SBC/revenue is declining modestly year-over-year, which is the right trajectory.
GAAP Gross Margin Compression (Monitoring Required):
GAAP gross margin compressed from 82% (2024) to 80% (2025) — a 200 basis point decline. If this trend continues, it suggests the platform is becoming more expensive to deliver as it scales, which is the opposite of the unit economics improvement one would expect from a maturing software business.
Possible causes:
Increased amortization of capitalized software development costs (mechanical, not operational concern)
Rising hosting costs as international expansion accelerates (operational concern)
Product mix shift toward lower-margin offerings (strategic concern)
AI compute costs beginning to impact COGS (emerging concern per management commentary)
Mitigant: Management has guided to maintaining gross margins in the 80–84% range (GAAP and non-GAAP, respectively) for 2026, suggesting the compression is stabilizing rather than accelerating.
9.2 Business & Strategic Red Flags
GTM Transformation Disruption (Largely Behind, But Not Fully Validated):
The go-to-market transformation implemented in 2024–2025 included:
Implementing a GM (General Manager) model with regional P&L accountability
Adding 200 net new sales resources (significant expansion of sales capacity)
Restructuring territories and account assignments (disruptive to customer relationships)
GTM transitions historically suppress bookings growth for 2–4 quarters while the organization absorbs new structures, learns new processes, and rebuilds momentum. Q1 2026’s 16% revenue growth and 21% cRPO growth suggest the disruption is largely behind Procore, but full validation requires another 1–2 quarters of sustained performance.
Risk: If Q2 2026 shows cRPO decelerating back below 18% or revenue growth slowing below 14%, it would signal that the GTM transformation is still causing friction.
Revenue Growth Deceleration (Structural or Cyclical?):
Revenue growth has decelerated from 32% (2023) → 21% (2024) → 15% (2025) → 16% (Q1 2026). Even if the slight Q1 2026 re-acceleration holds, Procore is operating in the 13–16% growth band, which is meaningfully below its historical peak.
Key question: Is this deceleration structural (market saturation, competitive pressure, product maturity) or cyclical (macro construction headwinds, GTM transition drag)?
Evidence for cyclical:
21% cRPO growth (leading indicator of future revenue acceleration)
95% gross retention (churn is not increasing)
Enterprise customer cohort growing 16% YoY (demand is intact)
Evidence for structural:
TAM penetration at 12–13% (still room to grow, but low-hanging fruit may be picked)
Competitive intensity increasing (Autodesk, Oracle, Trimble all investing heavily)
Consensus view: Primarily cyclical (macro construction headwinds and GTM transition), with a modest structural component. If macro improves (interest rates decline, construction spending recovers) and the GTM transformation completes successfully, revenue growth could re-accelerate toward 18–20% in 2027.
Rule of 40 Below Threshold (Quality Concern):
At approximately 31 (15% revenue growth + 16% FCF margin in 2025), Procore’s Rule of 40 is 9 points below the 40 threshold for quality software businesses. This is the single strongest quantitative signal that Procore is not yet a mature, high-quality SaaS compounder — it is still in the transition phase from growth-focused to efficiency-focused.
Trajectory: 2026 guidance suggests the Rule of 40 will improve to approximately 35 (16% growth + 19% FCF margin). If this trajectory continues, Procore could reach Rule of 40 ≥ 40 by 2027–2028. But this is not guaranteed and requires sustained execution.
9.3 AI-Specific Risk Assessment
Volume-Based Pricing Provides Structural Protection (Low Risk): The volume-based pricing model provides meaningful structural protection against AI per-seat substitution. An AI agent cannot reduce “construction volume” — it can only make construction more efficient, which potentially increases the volume of projects a contractor can handle with the same headcount.
Unbundling Risk from AI-Native Point Solutions (Moderate Risk, 5–10 Year Horizon):
Two specific AI risks deserve attention:
AI-native competitors targeting single workflows: A specialized AI platform for safety compliance, cost estimation, or schedule optimization could achieve 10× better performance on a narrow workflow and then expand adjacently. If a pure-play AI safety platform can predict incidents with 95% accuracy vs. Procore’s 70% accuracy, large contractors might adopt the specialist tool and reduce their Procore subscription scope.
AI-driven productivity gains reducing construction volume: If AI dramatically reduces the labor required per unit of construction (e.g., AI-enabled prefabrication, robotic construction, generative design optimization), the relevant unit of construction volume could shrink even as building activity stays flat. This is unlikely in the near term (construction is highly regulated and resistant to automation), but possible over a 10+ year horizon.
Procore’s AI investments as a mitigant:
Copilot: AI assistant for automating RFI responses, document search, and compliance documentation
Agent Studio: Workflow automation and agentic AI for field reporting and safety inspections
Datagrid acquisition: Reasoning/agentic AI engine forming the foundation for Procore’s AI product roadmap
Consumption-based AI revenue: Anticipated to scale in Q3 2026, creating a new revenue stream beyond core subscriptions
Net AI risk assessment: Manageable, not existential. Procore is investing appropriately in AI and has structural pricing advantages. The unbundling risk is real but addressable through continued product innovation.
9.4 Execution Risk: CEO Transition
New CEO in first year (Ajei Gopal started October 2025, ~7 months tenure as of May 2026). CEO transitions carry inherent execution risk:
Cultural disruption: A professional operator replacing a beloved founder can cause key employee departures
Strategic pivot uncertainty: New CEOs often make strategic changes that disrupt momentum
Customer relationship risk: Large enterprise customers may have personal relationships with the founder and could churn during transition
Mitigants:
Gopal’s track record at Ansys is strong (11% revenue CAGR, successful exit)
Courtemanche’s continued involvement as Board Chair provides continuity
No evidence of executive departures or customer churn spikes in Q1 2026 results
Strong Q1 2026 results (revenue beat, raised guidance) suggest execution is intact
Assessment: Moderate risk that diminishes with each successful quarter under Gopal’s leadership. By the end of 2026 (12–15 months tenure), this risk should be largely resolved.
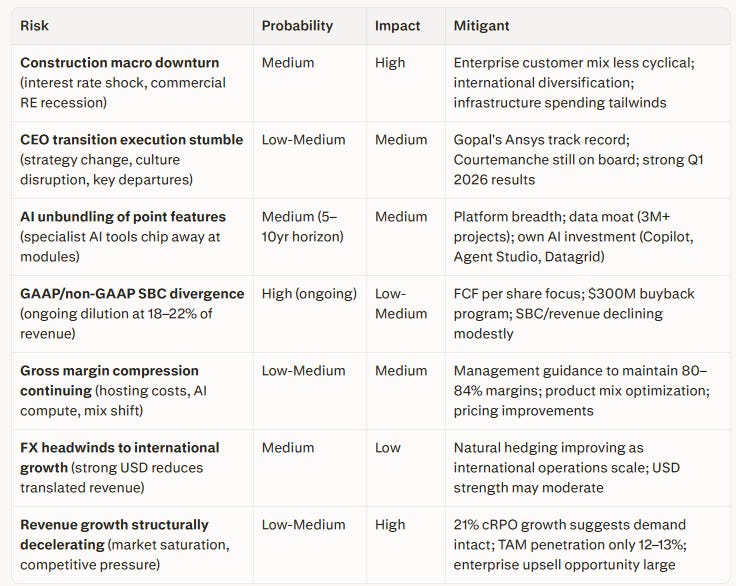
9.5 Risk Matrix
10. Overall Assessment
Moat Width Rating: Moderate to Wide
The workflow embedding moat — evidenced by 75% of ARR from 4+ product users, 95% gross retention, and the prohibitive organizational cost of platform migration — is genuine and strengthening. A typical enterprise customer with 5+ years on the platform has accumulated thousands of projects, multi-year financial records, safety compliance histories, and subcontractor performance data that are practically immovable.
The brand moat in the general contractor segment (Procore is synonymous with construction project management in North America) and the emerging data moat (data across 3M+ projects, though quality and contractual usability remain unverified) add secondary layers of protection.
This is not a narrow-moat business. The switching costs are high and growing, the brand is strong in its core segment, and the data asset is real (if early-stage).
Software Screening Threshold Summary
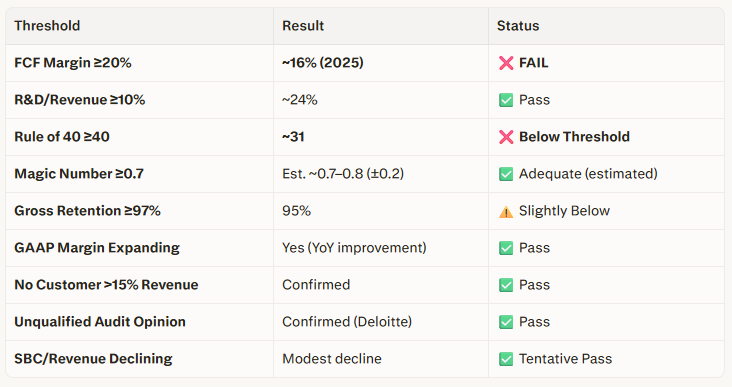
Critical observations:
Two key thresholds failed: FCF margin (16% vs. 20% required) and Rule of 40 (31 vs. 40 required)
Trajectory is positive: FCF margin guided to 19% (2026), GAAP operating margin improving 750bps YoY (Q1 2026)
This is a “show me” story: Procore must demonstrate in Q2–Q4 2026 that it can sustain the margin expansion trajectory and re-accelerate revenue growth
Probability of Long-Term Outperformance: 45–55%
Revised downward from 55–65% to reflect:
Weaker starting unit economics (16% FCF margin, Rule of 40 at 31)
Mixed Q1 2026 results (revenue beat, EPS miss)The
CEO transition is still early (only 7 months tenure)
However, the probability remains close to even odds (not bearish) due to:
Genuine workflow embedding moat (75% of ARR from 4+ products, 95% retention)
Strong leading indicators (21% cRPO growth, raised guidance)
Credible new CEO with relevant track record
Valuation discount (4.5× EV/Revenue vs. ~10× historical median)
At current prices of $46–47, the stock offers asymmetric risk/reward for investors willing to tolerate 6–12 months of “prove it” volatility while the company demonstrates:
Revenue growth can be sustained at 13–16% (cRPO growth ≥20% is the leading indicator)
FCF margin can expand toward 19–22% (Q2–Q4 2026 quarterly FCF margins are the proof points)
GAAP profitability is approaching (Q1 2026’s $(15.7M) operating loss suggests GAAP breakeven could arrive in 2027)
Key Risk Factors to Monitor
The thesis should be continuously monitored for these developments:
cRPO deceleration: If cRPO growth falls below 18% for two consecutive quarters, it would signal fundamental demand weakness rather than temporary GTM disruption → Thesis weakening
Gross margin compression: If GAAP gross margin falls below 78% (another 200bps decline), it would call into question platform scalability and unit economics → Thesis invalidation
Gross retention deterioration: If gross retention falls below 92% for two consecutive quarters, it would indicate competitive losses at scale or product dissatisfaction → Thesis invalidation
FCF margin compression: If Q2–Q4 2026 FCF margins average below 15% (well below the guided 19%), it would suggest management cannot deliver on margin expansion commitments → Thesis weakening
Large-deal competitive losses: If management commentary on earnings calls indicates Autodesk or Oracle is winning large enterprise renewals away from Procore, it would signal moat erosion → Thesis weakening
Exit Criteria (Pre-Defined Thesis Invalidation)
The position should be exited or significantly reduced if:
Gross revenue retention falls below 90% for two consecutive quarters (indicating competitive loss at scale or product-market fit deterioration)
Revenue growth decelerates below 10% for two consecutive quarters without a named macro explanation (recession, tariff shock, etc.)
Non-GAAP FCF margin retreats below 15% without explicit investment justification from management (indicating permanent margin structure issues)
A competitor (most likely Autodesk Construction Cloud) launches a compelling end-to-end platform that begins winning Procore customer renewals at scale (evidenced by management commentary acknowledging competitive pressure or gross retention declining)
CEO departure within the first 24 months (would indicate board dysfunction or strategic disagreement)
Position Sizing Recommendation
Under the moderate-to-wide moat framework and late-growth life cycle stage:
Full position target: 5–7% of portfolio (appropriate for a moderate-moat, mid-teens growth, improving-but-not-yet-mature FCF margin business)
Current entry conditions (as of May 17, 2026, at $46–47):
✅ Fundamentals re-accelerating (cRPO 21%, revenue growth 16%, raised guidance)
❌ Price not yet confirmed above 200-day MA (~$58–62) or even 50-day MA (~$52–54)
Recommended approach: 30–40% starter position (~2–3% of portfolio) with plans to scale up to a full 5–7% position upon:
Price confirmation: Stock reclaims $52–55 (50-day MA) on volume
Fundamental confirmation: Q2 2026 shows cRPO growth ≥20% and FCF margin ≥18%
Retention stability: Q2 2026 gross retention holds at ≥94%
Suggested buying range for starter position: $44–50
Suggested adding range for full position: $52–58 (after technical and fundamental confirmation)
Investment Opinion (For Reference Only)
Procore is a high-quality business at a reasonable price, not an exceptional business at a cheap price. The workflow embedding moat is real, the CEO transition is credible, and the FCF trajectory is improving. However, the company has not yet crossed the threshold into mature, high-quality SaaS economics (Rule of 40 at 31, FCF margin at 16%).
The stock’s 43% drawdown from its 52-week high of $82.32 to the current $46–47 has created a more attractive entry opportunity than existed earlier in 2026. At 4.5× EV/NTM Revenue, the market is pricing in:
Revenue growth of 8–10% (below management’s 13–16% guidance)
FCF margin stalling at 16–18% (below management’s 19%+ trajectory)
No multiple re-rating toward peer median (~7×)
If management delivers even halfway between current market pessimism and their own guidance, the stock should re-rate to $60–75 within 12–18 months (base case). If the bull case materializes (AI products scale, revenue re-accelerates to 18%+, FCF margin reaches 22%+), the stock could reach $90–110 within 24 months.
Patient investors who can tolerate 12–18 months of continued growth-rate deceleration noise while the GTM transition completes and AI products begin contributing revenue have a reasonable risk/reward profile. The probability-weighted two-year price target of $72 represents approximately 55% upside from current levels, with asymmetric upside to $90–110 if the bull case materializes.
The next 2–3 quarters (Q2–Q4 2026) are definitive. They will either confirm that Procore is on the path to 20%+ FCF margins and re-accelerating growth (validating the bull case), or reveal that the margin expansion story is stalling and competitive pressure is intensifying (validating the bear case). Current valuation provides a margin of safety for the uncertainty.
Recommended Action
For investors willing to take a staged approach:
Step 1 (Now): Initiate a 2–3% position at $44–50
Step 2 (Q2 2026): If Q2 results show cRPO ≥20%, FCF margin ≥18%, and gross retention ≥94%, add to a 4–5% position at $52–58
Step 3 (Q3–Q4 2026): If AI revenue scales as guided and the FCF margin trajectory holds, complete to 5–7% full position at $58–65
For investors requiring higher conviction before entry:
Watch and wait for:
Two consecutive quarters of 20%+ cRPO growth AND 18%+ FCF margin
Stock reclaiming 50-day moving average (~$52–54) as technical confirmationThe
CEO’s first 12 months to pass (October 2026) without major execution stumbles
This approach sacrifices upside from the current $46 entry in exchange for higher confidence, but it is a defensible conservative posture given the “show me” nature of the investment.
Disclaimer: This analysis is for educational and informational purposes only and does not constitute investment advice. All investment decisions should be made with your own due diligence and, where appropriate, consultation with a qualified financial advisor. Past performance does not guarantee future results. The author may hold a position in the securities discussed.