
Progress Software Corporation (NASDAQ: PRGS)
PRGS isn't a growth story — and that's exactly why the deleveraging math is worth understanding right now.

Date: May 12, 2026 | Classification: Deep Value / Deleveraging Compounder
Data sources: SEC 10-K FY2025 (filed Jan 20, 2026), Q1–Q4 FY2025 8-Ks, Q1 FY2026 earnings release (March 30, 2026), amended credit facility filings (March 2024, July 2025), SEC convertible note indentures.
1. Investment Thesis
Progress Software is a mature subscription-compounding enterprise software company with a deeply embedded legacy platform (OpenEdge) and a portfolio of acquired SaaS assets. The business is organically stagnant — generating 1–2% constant-currency ARR growth and net retention of 99% — and the stock has de-rated from a 52-week high of $65.50 to approximately $28, compressing the trailing GAAP P/E to ~16.7x and producing a levered FCF yield of 16–17%.
The core opportunity is not a return to high growth. It is a multi-year balance sheet normalization: sustained deleveraging at ~$60M per quarter, combined with disciplined capital allocation, can mechanically lift GAAP earnings per share without any organic revenue re-acceleration. This is correctly classified as a deleveraging compounder thesis, not a growth turnaround thesis.
The $840M in undrawn revolver capacity introduces a binary catalyst: deployed at historically disciplined multiples, it can compound cash flow per share; deployed poorly, it delays the deleveraging trajectory and widens the GAAP/non-GAAP earnings gap further.
Entry conditions — fundamental ARR re-acceleration and price above the 200-day moving average — remain unmet. The levered FCF yield justifies a starter position of 20–30% of target allocation. Full sizing requires two consecutive quarters of ARR constant-currency growth above 3% and price reclaiming the 200-day moving average on above-average volume, accompanied by confirmed sustained debt repayment.
 Gives Strong Guidance")
2. Business Model
Progress generates revenue across five product lines:
OpenEdge: A 30+-year proprietary development platform and embedded database. The primary cash engine is deeply embedded in ISVs across healthcare, insurance, and financial services. Switching costs are prohibitively high — an ISV that built its core application on OpenEdge faces years of re-engineering to migrate. This is the moat; it protects the base but does not expand it.
ShareFile: Cloud content management and file-sharing, acquired from Cloud Software Group in late 2023. The primary driver of the reported FY2025 ARR surge is now fully lapped as of Q4 FY2025. Faces ongoing competitive pressure from Microsoft 365, Box, and Dropbox.
Telerik / Kendo UI: Developer UI component libraries. Under structural pressure from AI-assisted coding tools (GitHub Copilot, Claude Code).
Sitefinity: Digital experience/CMS platform. Moderate competitive moat.
DataDirect: Data connectivity drivers. Niche but stable.
Revenue is approximately 75% recurring (maintenance, SaaS, professional services) and 25% license. The customer base is mid-market to enterprise, concentrated in vertical-industry ISVs.
3. Financial Analysis
3.1 Revenue and ARR Trajectory
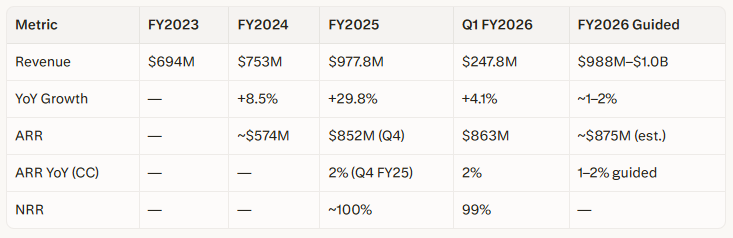
Critical analytical note: The 29.8% FY2025 revenue growth and the 46–48% ARR YoY figures in Q1–Q3 FY2025 are entirely explained by the ShareFile acquisition base comparison, not organic demand acceleration. Once ShareFile was fully lapped in Q4 FY2025, underlying ARR constant-currency growth was 2% — which management has now guided as the FY2026 full-year baseline. Any analysis citing the 46–48% ARR growth as evidence of business momentum is structurally incorrect.
The Q1 FY2026 NRR decline to 99% (from the company’s own 100%+ target) was attributed to a single seven-figure government contract termination in Eastern Europe, driven by a court ruling — not a product issue — but it illustrates geographic and institutional revenue concentration risk.
3.2 Profitability
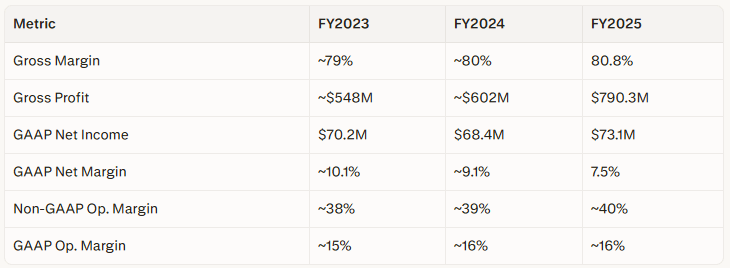
The ~22–24 percentage-point gap between GAAP and non-GAAP operating margins is structural, not transitory. It reflects:
Amortization of acquired intangibles — the real but non-cash cost of the M&A-driven growth model, running at approximately $130–$150M/year
Stock-based compensation — approximately $40–50M/year
Acquisition and integration costs — recurring in an acquisitive compounder
Investors who anchor to non-GAAP metrics are looking at a materially different business than the GAAP reality. The non-GAAP 40% operating margin is a useful efficiency indicator; it is not the correct earnings base for valuation.
GAAP EPS Trajectory: Q1 FY2026 GAAP diluted EPS was $0.54, representing 125% YoY growth — driven by lower interest expense on the prior year base, cost discipline, and buybacks. This is a genuine positive signal, partially offset by the incremental ~$18.6M/year interest headwind from rolling the 2026 convertible notes into the revolver (see Section 3.4).
3.3 Free Cash Flow — The Primary Valuation Anchor
Management FY2026 guidance, presented in three tiers for analytical transparency:
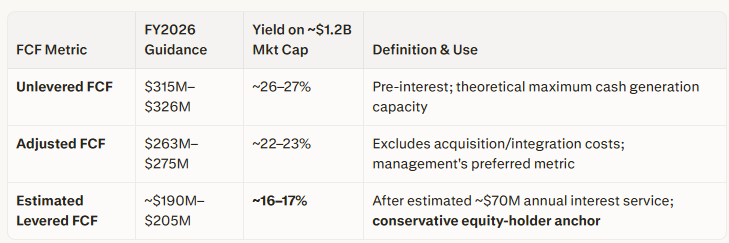
The levered FCF yield of 16–17% is the primary valuation anchor for this thesis. It represents the cash return available to equity holders after servicing the debt load, and it is exceptional for a software business with no structural revenue decline. The adjusted FCF yield of 22–23% is the realistic mid-case if management’s treatment of acquisition costs as non-recurring is accepted.
Note: FY2025 full-year operating cash flow was not confirmed in available sources. Q3 FY2025 alone generated $73.4M operating cash flow; FY2024 full-year OCF was $212M. The FY2026 adjusted FCF guidance of $263–275M implies improvement over FY2024 levels, consistent with the deleveraging trajectory. FY2025 full-year OCF should be verified from the 10-K directly.
3.4 Balance Sheet and Leverage
Debt structure as of Q1 FY2026:
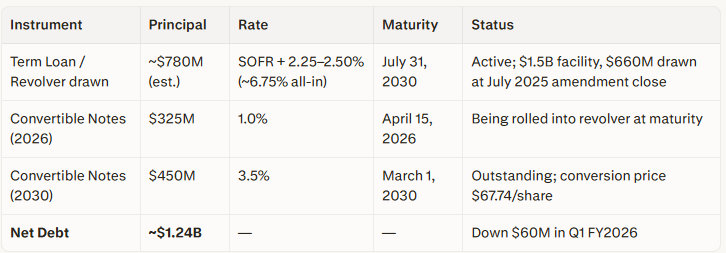
The 2026 notes roll replaces $325M at 1.0% with revolver borrowings at ~6.75% all-in. Net incremental annual interest cost: ($325M × 6.75%) − ($325M × 1.0%) = ~$18.6M/year. This directly offsets a portion of the Q1 FY2026 GAAP EPS improvement. Management has explicitly acknowledged this headwind in revised EPS guidance.
The 2030 convertible notes ($450M, conversion price $67.74) present no near-term dilution risk. At $28/share, the stock is at 41% of the conversion price. The 130% trigger threshold requires the stock to reach ~$88 — a >3x move from current levels — before conversion becomes relevant. If full conversion were triggered at that elevated price, it would create approximately 6.64 million new shares, representing ~13.6% dilution on the current ~48M share base. This is a manageable dilution scenario in a context where shareholders have already realized a 200%+ return.
Liquidity assessment:
Raw current ratio: 0.47x (short-term assets $370M vs. short-term liabilities $788M) — appears weak
Deferred revenue adjustment: ~$300M of current liabilities is deferred revenue, which represents service obligations rather than cash outflows
Economically adjusted current ratio: ~0.76x — still below 1.0x, but not a near-term solvency threat
Remaining $840M in undrawn revolver capacity provides substantial liquidity backstop
Deleveraging path:
At the Q1 FY2026 pace of $60M/quarter ($240M/year), net debt of $1.24B reaches approximately $500M by FY2029. This is the structural balance sheet normalization catalyst — it does not require organic revenue growth and is mechanically achievable from existing cash flows.
Note: The $60M/quarter pace is based on one quarter of data following the July 2025 revolver upsize. The Q2 FY2026 10-Q (expected around June 29) is the first clean read on whether this pace is sustainable under the expanded facility. It should be verified at the June 29 earnings call.
3.5 GAAP Earnings Normalization Projection (FY2029)
Under the base-case scenario — defined as (1) no large acquisition resetting the amortization clock, (2) stable revenue at approximately $988M–$1.0B, and (3) SOFR remaining near 4.5% — the interest expense savings from deleveraging mechanically lift GAAP net income:
Estimated GAAP earnings by FY2029: $95–$100M base case
Sensitivity range: $80M–$110M, depending on M&A activity, rate environment, and revenue trajectory
Implied forward GAAP P/E at current market cap ($1.2B): ~11–15x — compelling even at the low end of earnings
This projection does not require an organic growth recovery. It is a pure balance-sheet normalization thesis driven by interest expense reduction.
4. Capital Allocation
4.1 M&A Strategy — Base-Rate Grounded
Progress has completed six acquisitions since 2017. Only ShareFile materially moved the revenue needle; all acquisitions have ultimately stabilized at NRR ~99–100% without sustainably improving organic growth.
The base rate is clear: M&A is a cash flow compounding strategy, not an organic growth strategy. Any new acquisition, regardless of headline quality, will likely:
Temporarily inflate ARR comparisons for 3–4 quarters (repeating the FY2025 distortion)
Add incremental intangible amortization, widening the GAAP/non-GAAP gap
Stabilize at the same 1–2% organic ARR baseline once lapped
The correct framing of the M&A bull case is: “Expand cash flow per share if acquired at distressed multiples and integrated to the ~40% non-GAAP margin target — without requiring organic ARR acceleration.” This aligns with the company’s actual historical playbook.
The $840M in undrawn revolver capacity is a binary catalyst: disciplined deployment compounds equity value; poor deployment reverses the deleveraging progress and may extend the period of GAAP earnings suppression.
4.2 Share Repurchase Program
Progress has an active share repurchase authorization. At a 16–17% levered FCF yield, buybacks at $28 are mathematically accretive — each dollar retired at current prices generates higher per-share earnings than any realistic acquisition target’s cash flow yield. The precise FCF allocation between debt repayment and buybacks in FY2026 has not been publicly confirmed.
This is a critical watch item for June 29: if buybacks are favored over debt repayment, the deleveraging timeline extends, but per-share value compounds faster. Full dedication to debt repayment solidifies the balance sheet catalyst. The capital allocation priority is the single most important operational question management should be asked on the June 29 call.
5. Competitive Dynamics (Porter’s Five Forces)
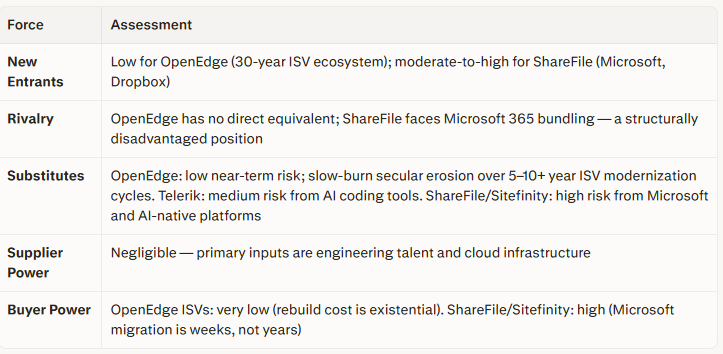
Net moat assessment: Strong and durable on the OpenEdge legacy base (switching costs). Narrow to weak on the SaaS/cloud layer (~30–40% of revenue). The moat protects existing cash flows; it does not generate new demand. NRR of 99% is the empirical confirmation of this bifurcation.
6. Macro and Industry Environment
AI disruption risk: Mild structural headwind on developer tools (Telerik) and content platforms (ShareFile, Sitefinity). Neutral on the OpenEdge legacy transaction processing base — AI tools do not easily substitute for embedded ISV application infrastructure.
Interest rate risk: The most significant macro variable. Each 100bps increase in SOFR adds ~$7–8M/year in interest expense on the current revolver balance. Sustained higher rates delay the GAAP earnings normalization trajectory.
FX exposure: ~36% of FY2025 revenue was international, creating 1–2% constant-currency vs. reported revenue divergence in recent quarters. Modest but persistent headwind.
Sector re-rating: The software application sector declined approximately 22.7% in early 2026 on AI disruption fears. Progress’s de-rating from $65 to $28 is partly sector-driven, not exclusively company-specific. A sector re-rating recovery would be a tailwind independent of fundamentals.
Eastern Europe government contract churn: One confirmed Q1 FY2026 event; not a product issue, but a flag on geographic revenue concentration.
7. Valuation
7.1 Current Multiples
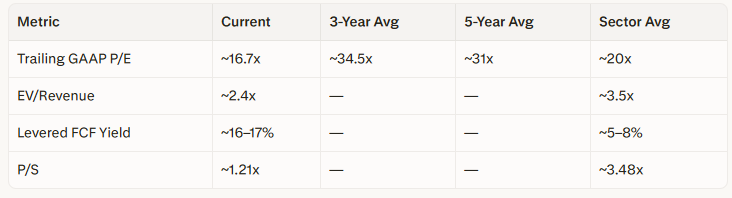
The stock is trading at approximately a 50% discount to its own 3-year and 5-year average GAAP P/E multiples, and at roughly one-third of the sector P/S average. At 2.4x EV/Revenue with 80%+ gross margins and a positive FCF profile, this is not a typical valuation profile for a structurally broken business.
7.2 Analyst Consensus
Five analysts cover PRGS. Post-Q1 FY2026 target cuts: Wedbush $45, Oppenheimer $57, Citi $46, DA Davidson $50 (Buy), Jefferies $34 (Hold). Consensus target implies approximately 80–120% upside from $28. The spread ($34–$57) reflects genuine disagreement on AI disruption impact and M&A risk, not a consensus view.
7.3 Entry Conditions (Two-Condition Framework)
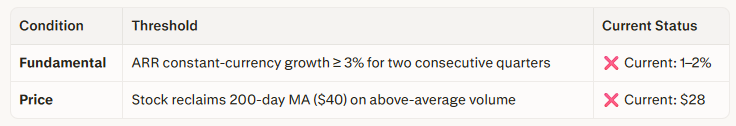
Starter position (20–30% of target): Defensible now on levered FCF yield (16–17%) and resolved 2026 maturity risk. Neither condition is required for a partial entry justified purely on deep-value grounds.
Full position (80–100% of target): All three upgrade conditions must be met simultaneously — (1) ARR ≥ 3% CC for two consecutive quarters, (2) price above 200-day MA, and (3) Q2 FY2026 confirms $60M+ quarterly deleveraging is sustained.
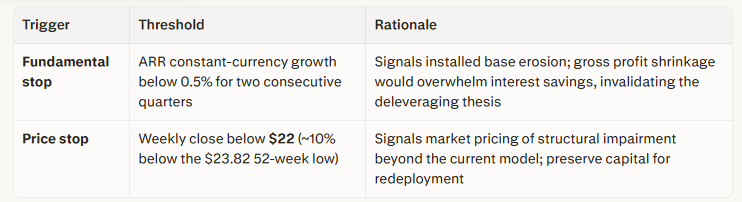
8. Risk Management
8.1 Stop-Loss Parameters
8.2 Key Risks Ranked
M&A misallocation — the $840M dry powder deployed into an overpriced or strategically misaligned acquisition would reset the amortization clock and delay GAAP normalization by 3–4 years. This is the highest-probability path to thesis invalidation.
SOFR rate increase — each 100bps rise adds ~$7–8M/year in interest expense, compressing GAAP earnings and extending the normalization timeline.
OpenEdge secular erosion — if ISV migration to cloud-native platforms accelerates beyond the base-case 3–5% annual attrition assumption, the gross profit pool shrinks faster than interest savings accrue.
ShareFile competitive displacement — Microsoft’s bundling advantage in the enterprise content management space is structural and ongoing.
Management credibility gap — the 22pp GAAP/non-GAAP divergence and the acquisition-inflated ARR comps require that investors apply permanent skepticism to management’s preferred metrics.
9. Upcoming Catalysts
June 29, 2026 — Q2 FY2026 Earnings Call (Primary Checkpoint)
Watch items, in order of importance:
ARR constant-currency growth — does it hold at 2%, decline, or begin accelerating toward 3%?
Capital allocation split — what portion of levered FCF is directed to debt repayment vs. buybacks?
Deleveraging pace — is the $60M/quarter rate confirmed as a sustained run-rate under the $1.5B facility?
M&A commentary — any indication of acquisition pipeline activity or deal structure preferences
Revenue vs. guidance — Q2 guidance of $240–246M; a miss here is a meaningful negative signal given the pattern from Q1
FY2026 10-Q (expected alongside June 29 earnings): Will confirm exact revolver balance, drawn amount post-April 2026 maturity roll, and Q2 interest expense. The $18.6M incremental interest estimate will be verifiable against actual figures.
10. Final Scorecard
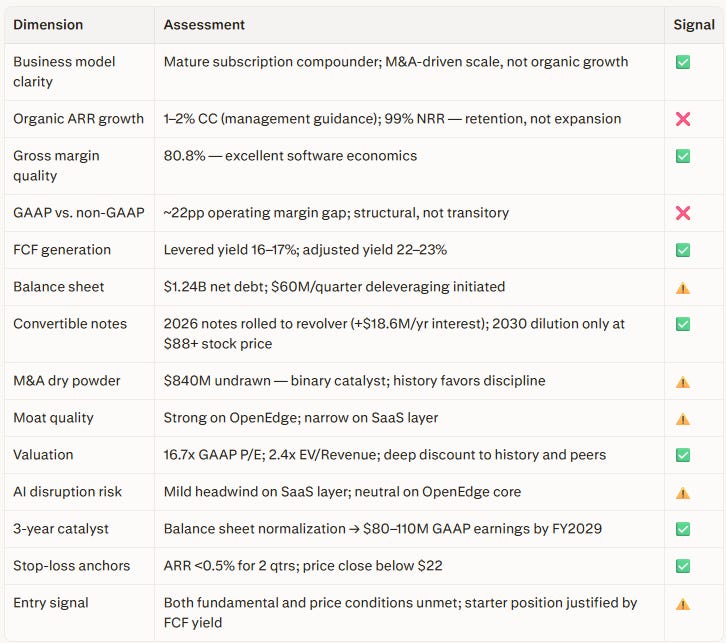
11. Conclusion
Progress Software is not a growth story. The market correctly prices it as a mature, slow-decay compounder, and the severe de-rating from $65 to $28 reflects both legitimate AI disruption fears and the absence of organic growth catalysts. What the market may be underpricing is the quality and durability of the cash generation engine: a 16–17% levered FCF yield on a business with switching-cost-protected revenue, 80%+ gross margins, and an active deleveraging program is not a standard profile for a structurally impaired company.
The three-year balance sheet normalization path — from $1.24B net debt today to below $500M by FY2029, driving GAAP earnings toward $95–100M without requiring revenue growth — is the thesis. It is mechanical, not speculative. The primary risk to that thesis is not market sentiment or AI disruption. It is management’s deployment of the $840M in M&A dry powder. History favors disciplined execution; a single poorly structured acquisition would set the clock back three years.
For patient, value-oriented investors, a starter position is defensible at current prices with clearly defined fundamental and price-based stop-losses. The June 29, 2026, earnings call is the next major information event. The full investment case matures as deleveraging is confirmed, capital allocation is clarified, and — eventually — the organic ARR baseline either stabilizes or re-accelerates above the 3% threshold required for full conviction.
This report is for informational and educational purposes only and does not constitute investment advice. All financial estimates, including future earnings projections, interest rate assumptions, and free cash flow forecasts, are based on publicly available information as of May 12, 2026. The $70M annual interest expense estimate, the $18.6M incremental cost from the 2026 notes refinancing, and the FY2029 GAAP earnings projection ($80M–$110M range) are derived estimates, not confirmed figures, and are subject to revision upon publication of the Q2 FY2026 10-Q. FY2025 full-year operating cash flow was not confirmed from available sources and should be verified directly from the FY2025 10-K. Investment decisions should be made with independent due diligence and, where appropriate, consultation with a qualified financial advisor. Past performance does not guarantee future results.