
TSMC Deep Analysis Report — Semiconductor
66% gross margins, $106 billion in cash, and a monopoly on the exact node every hyperscaler needs — this is what a real moat looks like in 2026.

Taiwan Semiconductor Manufacturing Company Limited | TWSE: 2330 / NYSE: TSM
Analysis date: May 13, 2026. All financial data sourced from TSMC SEC filings (Form 6-K), TSMC IR site, and third-party data providers as cited.
1. Company Snapshot
TSMC is the world’s dominant pure-play semiconductor foundry, manufacturing integrated circuits and wafers on a contract basis for fabless designers. It occupies the single most critical choke point in the global electronics supply chain: advanced-node wafer fabrication.
As of Q1 2026, TSMC generated revenue of US$35.90 billion for the quarter, up 40.6% year-over-year, with full-year 2026 revenue expected to grow above 30% in USD terms. The stock trades at approximately $404 per ADR unit as of May 11–13, 2026, with a forward P/E of ~25.8x. Sub-industry classification: Foundry (≤7nm / advanced) — the framework’s highest-structural-quality pool.

2. Bottleneck Scorecard Assessment
Dimension 1 — Demand Momentum (Weight: 30%)
The structural demand picture is exceptional. Google, Amazon, Microsoft, and Meta collectively plan to spend an estimated $725 billion on capex in 2026, up approximately 77% from the prior year’s record. Roughly 75% of this — approximately $450 billion — is directly tied to AI infrastructure. This is not merely volume expansion; it is value-dense, node-specific demand concentrated at the leading edge of fabrication where only TSMC can deliver at commercial yield.
TSMC’s Q1 2026 guidance points to Q2 revenue of $39.0–$40.2 billion, with gross margin guidance of 65.5–67.5% — an exceptional step-up driven by strong demand for leading-edge process technologies.
Score: 92/100. Demand is accelerating rather than decelerating at the node layer that matters most to TSMC.
Dimension 2 — Supply Tightness (Weight: 25%)
TSMC’s Q1 2026 gross margin reached 66.2%, up 3.9 percentage points sequentially and 7.4 points year-over-year — a direct signal that pricing power is not only intact but expanding. Customers pre-paid NT$291.1 billion in 2024 to secure future capacity, a structural indicator of supply scarcity at the leading edge.
TSMC’s 2025 capital budget is $38–42 billion, with ~70% allocated to advanced process technologies. For N2, multiple industry sources now align on an initial capacity of approximately 35,000–40,000 wafers per month at Fab 20 (Hsinchu Baoshan), scaling to approximately 120,000–140,000 wpm by end-2026 across both Fab 20 and Fab 22 (Kaohsiung), and potentially 200,000 wpm by 2027. Demand chronically leads supply additions at the most advanced node.
Score: 85/100. Pre-paid capacity commitments and rising ASPs are definitive supply-tightness signals.
Dimension 3 — Concentration / Lock-in (Weight: 25%)
TSMC’s global foundry market share reached 70.2% in Q2 2025 (TrendForce), up from 67.6% in Q1 2025, while Samsung Foundry held 7.3%. At the advanced node specifically (3nm, 2nm), TSMC’s share is upwards of 90%. Samsung’s 2nm yield is reported at approximately 40%, while TSMC has achieved yields above 60%, crossing the commercial production threshold.
Intel’s foundry division remains structurally loss-making and has acknowledged schedule slippage on 18A. The moat at the leading edge is not purely technological — it is also institutional trust. Major customers (Apple, NVIDIA, AMD, Qualcomm) have multi-year design-in cycles of 2–4 years to unwind, and switching carries catastrophic yield and schedule risk.
Score: 90/100. Near-monopoly at the 3nm/2nm node layer; lock-in is deep and not shrinking on any observable horizon.
Dimension 4 — Execution Quality (Weight: 20%)
Full-year 2024 ROE increased to 30.3%. Net profit margin reached 50.5% in Q1 2026, up 7.4 points year-over-year. Free cash flow for Q1 2026 was NT$348.21 billion. Cash and marketable securities stood at NT$3,383.60 billion (~US$106 billion) at quarter end. Gross margins have been on a structural uptrend — from 53% in early 2024 to 66.2% in Q1 2026 — while the N2 ramp proceeds with yields above the commercial threshold. TSMC’s execution record across five technology generations is essentially unblemished; no comparable competitor has replicated it.
Score: 88/100. Margins expanding, ROE strong, cash position exceptional.
Scorecard Synthesis
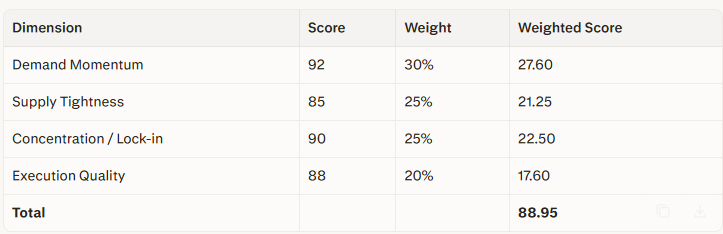
Classification: INVESTABLE. No single dimension scores below 30 — the catastrophic-weakness override does not trigger. This is one of the highest-scoring sub-industry environments the framework can produce.
3. Business Model & Bottleneck Position
TSMC is a pure-play foundry: it owns no product IP, designs no chips, and sells no end consumer products. Its value is exclusively in the manufacturing process execution. Every major fabless company — NVIDIA, Apple, AMD, Qualcomm, MediaTek — depends on TSMC to physically realize their designs.
TSMC’s full-year 2024 revenue grew 30% in USD terms, outperforming the foundry industry’s ~6% growth, reaching a record US$90.08 billion. Revenue concentration is real but not alarming: the top 10 customers accounted for 76% of net revenue in 2024, while the single largest customer represented 22% of net revenue (widely inferred to be Apple; TSMC does not officially name customers). NVIDIA’s share has grown substantially with AI chip demand.
The key framework question: Is TSMC a controller or consumer of the bottleneck? TSMC IS the bottleneck. No advanced semiconductor chip can be manufactured elsewhere at a commercial scale or acceptable yield. That is not marketing — it is a verifiable, observable fact supported by competitors’ public yield disclosures and market share data.
4. Financial Quality Analysis
DuPont ROE Decomposition
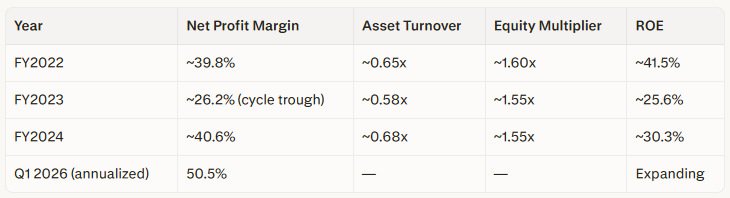
Note: FY2022–FY2024 equity multiplier figures are estimated from reported TSMC financials; full-year 2024 ROE of 30.3% is confirmed. The DuPont decomposition shows margin recovery, not leverage expansion*, driving the ROE improvement — the high-quality version of ROE growth.
FCF Conversion
Full-year 2024 operating cash flow was NT$1.8 trillion. With net income of NT$1,173.27 billion, that implies an operating-cash-to-net-income ratio of approximately 1.53x — well above the 0.7x quality threshold. Q1 2026 free cash flow was NT$348.21 billion on net income of NT$572.48 billion, implying an FCF/NI ratio of approximately 0.61x — temporarily compressed by the $38–42 billion 2025 capex cycle. This is expected, and not a concern; heavy capex investment at peak demand is the correct capital allocation decision, not a deterioration signal.
Revenue and EPS Growth Trajectory
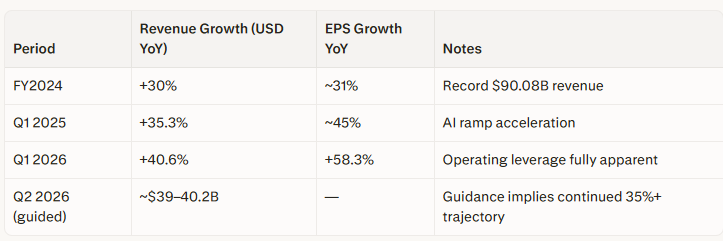
Earnings growth outpacing revenue growth is the classic signature of operating leverage on a high-fixed-cost, high-gross-margin business. Composite financial quality score: Top quartile. The financial quality screen is passed without qualification.
5. Competitive Position — Porter’s Five Forces
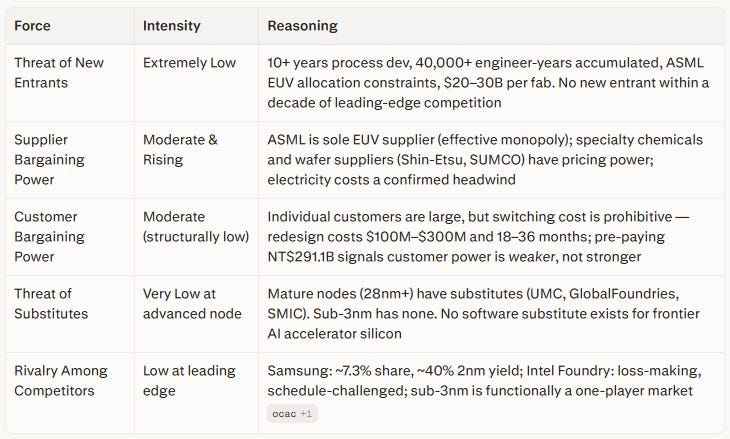
6. Moat Analysis
Technology / IP Moat
Wide and deepening. TSMC’s process knowledge is not codifiable or transferable — it resides in thousands of process steps, equipment configurations, and defect-management procedures built over decades. The N2 nanosheet GAAFET architecture represents a significant transition that TSMC is executing at commercially viable yields while competitors remain below threshold.
Switching Cost Moat
Extreme. Chip design is tightly coupled to the foundry’s design rule manuals, process design kits (PDK), and IP libraries. An NVIDIA Blackwell-class chip or Apple A18 cannot be manufactured on a different process without a complete redesign — a multi-year, multi-hundred-million-dollar project. This is not a soft switching cost; it is a fundamental architectural dependency.
Scale Moat
Wide. TSMC’s 2024 revenues of $90.08 billion provide R&D and capex capacity that no competitor can match in proportion. Higher volume across more customers drives a faster learning curve descent, lower per-wafer cost, and faster defect-density reduction.
Ecosystem / Design Platform Moat (Distinct Mechanism — Demand-Side Lock-in)
This moat operates through a fundamentally different mechanism than the technology moat above and should be evaluated separately. TSMC’s Open Innovation Platform (OIP) hosts a certified ecosystem of EDA tool vendors (Cadence, Synopsys, Siemens/Mentor), IP providers (ARM, Imagination), and equipment partners who develop and certify tools specifically for TSMC process nodes. Siemens EDA’s full Calibre suite, Solido Simulation Suite, and Aprisa tool have all been certified for TSMC’s N3C, N2P, and A16 nodes as of 2025, enabling designers to access industry-standard signoff technology only within TSMC’s design environment.
The critical distinction: even a technologically equivalent competitor cannot replicate this moat by process capability alone. A fabless customer using TSMC-certified IP blocks, PDK-tuned standard cell libraries, and OIP-validated EDA flows would need to rebuild every one of those design assets for a different foundry’s process — at substantial cost and delay. The ecosystem lock-in compounds over time as more IP vendors prioritize TSMC certification due to market share, which in turn attracts more designers, which reinforces market share dominance. This is a genuine demand-side network effect, not a supply-side capability barrier.
Unique Resources
TSMC is the largest customer of ASML’s High-NA EUV equipment, giving it preferential capacity allocation and collaborative process development advantages not available to competitors on equivalent terms.
Moat Classification: Wide — the combination of technology depth, switching cost, scale, and ecosystem network effect creates one of the widest competitive moats in the global industry.
7. Valuation Analysis
Lifecycle Stage
Growth-to-Mature transition. TSMC is growing at 30–40% revenue CAGR while maintaining 50%+ net profit margins — an unusual combination for a company at this scale. The correct lifecycle framing is a mature technology platform benefiting from a structural secular demand shift (AI), not a startup growth story.
Multiple Analysis
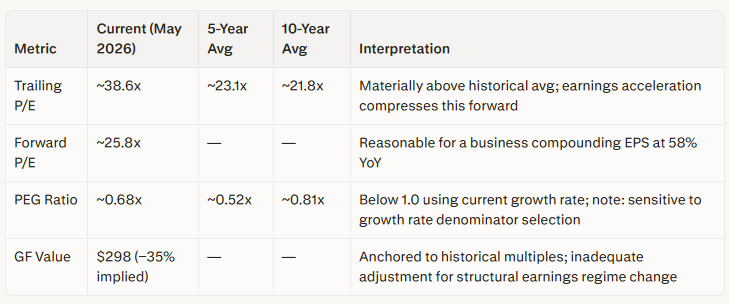
Note: PEG ratios are highly sensitive to the growth rate used as the denominator. A PEG of 0.68x is defensible using the current 40%+ growth rate, but would be higher using a normalized 5-year forward CAGR of 20–25%. Presented here using the current growth rate per cited source.
Price Opinion
⚠️ Fairly Valued to Modestly Overvalued on a trailing basis; Fairly Valued on a forward and PEG-adjusted basis.
The trailing P/E of 38.6x is materially above the 10-year average of 21.8x, but: (a) the business is compounding EPS at 58% year-over-year, (b) the forward P/E of 25.8x is on rapidly rising consensus estimates, and (c) the PEG of 0.68x indicates the growth rate is more than pricing in the current multiple. The GF Value of $298 (implying 35% overvaluation) uses a historically anchored formula that does not adequately reflect the structural regime change in TSMC’s earnings power since 2023. That said, the stock is not cheap, and multiple compression from macro or geopolitical shock would be painful from current levels.
8. Entry Timing Assessment
TSM trades at approximately $404 per share as of May 11–13, 2026. Given the fundamental strength of the thesis, the framework’s guidance for a starter position (30–40% of intended allocation) is defensible even without all four technical conditions confirmed, provided:
The scorecard is Investable ✅ (confirmed — 88.95)
Financial quality is top-quartile ✅ (confirmed)
The position is not being chased immediately post a major earnings beat that has already re-rated the multiple (check against the current chart before entry)
Position sizing discipline: No more than 2.5% of a diversified portfolio per individual semiconductor position; total semiconductor sector exposure capped at 20%.
Exit discipline: Reduce on RSI > 80 on daily close; exit if the stock closes below its 10-day MA on above-average volume; full liquidation if the sub-industry bottleneck score falls below 50 at the next quarterly re-scoring.
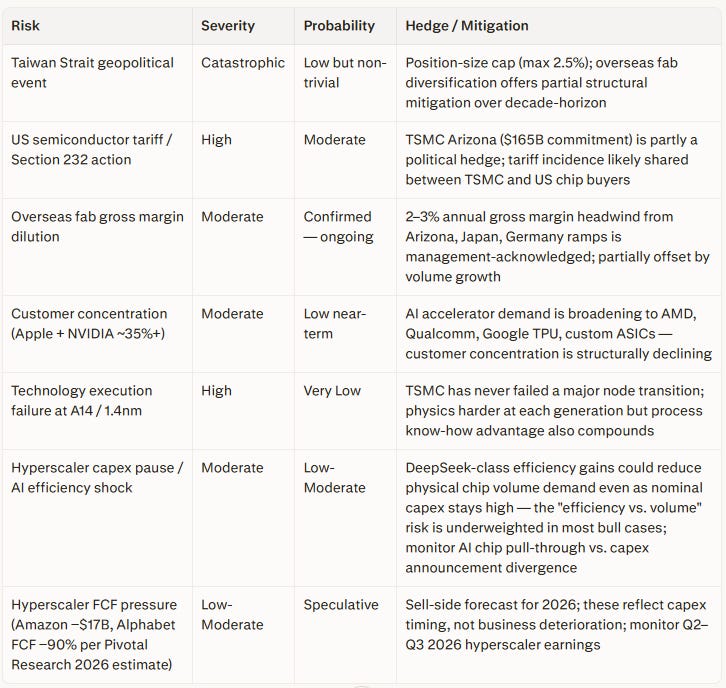
9. Risk Register
10. Overall Assessment
TSMC is the cleanest expression of the “bottleneck owner” thesis in the global industry. It is not merely a good company in a good industry — it is the irreplaceable physical choke point through which every advanced semiconductor must pass.
The structural demand from hyperscaler AI capex is not a cycle. Big tech AI capex has grown from approximately $162 billion in 2022 to an estimated $448 billion in 2025, and the combined 2026 capex plan for the four hyperscalers is approximately $725 billion. This is not decelerating. TSMC’s margins are expanding with it. Meanwhile, Taiwan’s total exports reached a record $640.75 billion in 2025, driven by AI-related electronics — electronics components and ICT together now constitute approximately 74% of Taiwan’s total exports. This contextualizes TSMC’s macro importance and the scale of the demand wave it is riding.
Investment opinion: Strong Invest, with one material caveat.
The caveat is geopolitical risk, and it must be stated bluntly. TSMC produces roughly 90% of the world’s most advanced chips, the broader electronics and ICT complex constitutes the overwhelming majority of Taiwan’s export base, and the company is inextricably linked to the most consequential geopolitical fault line in the world. Analysts estimate that a disruption of Taiwan’s semiconductor output could cost the global economy an estimated $2.5 trillion in annual losses. TSMC has pledged to invest a total of $165 billion in the United States across a series of Arizona fabs, alongside investments in Japan (Kumamoto) and Germany (Dresden), providing meaningful but incomplete geographic diversification. Overseas fab ramps are expected to cause approximately 2–3% gross margin dilution annually over the next five years — a confirmed, management-acknowledged headwind, not a tail risk.
The geopolitical risk is unquantifiable and cannot be modeled away. It is the single factor that justifies keeping TSMC within position-size discipline (max 2.5% of portfolio) rather than sizing it as a core holding. Investors should be clear-eyed: they are being compensated for this risk through an exceptional business at a forward multiple that is not extreme. Whether that compensation is adequate is a judgment call that depends on the individual investor’s geopolitical views and portfolio construction constraints.
Disclaimer: This analysis is for educational and informational purposes only and does not constitute investment advice. All investment decisions should be made with your own due diligence and, where appropriate, consultation with a qualified financial advisor.